A new service from Westmount, offered exclusively to Schwab Financial Consultants
SANbox combines a dedicated FC service team with timely communications, useful marketing insights, and an online toolkit–all designed to help FCs strengthen client relationships, improve collaboration and efficiency, and grow their business.
About Westmount
Our ideal client is
Large
Over $10 million in liquid assets; over $25 million in total net worth
Curious
Interested in new and compelling investment ideas, including private markets
Complex
Has many moving parts in their financial life and sophisticated planning needs
Your Westmount Client Team
Relationship Specialists: Your Westmount Concierge
Relationship Specialists serve as a dedicated resource for Financial Consultants. Their sole focus is to provide an enhanced level of service and support to FCs. Their direct responsibilities include:
- Communicating firm news, differentiators, resources, and case studies.
- Developing customized business plans and service protocols for each FC.
- Regularly updating FCs on their Westmount clients, opportunities for additional assets, and referrals.
- Helping plan and organize client events and webinars.
- Hosting professional development and training seminars.
- Providing networking opportunities with trust and estate attorneys, CPAs, and other local COIs.
- Connecting FCs to senior members of the Westmount team.


Strategy and Service Highlights
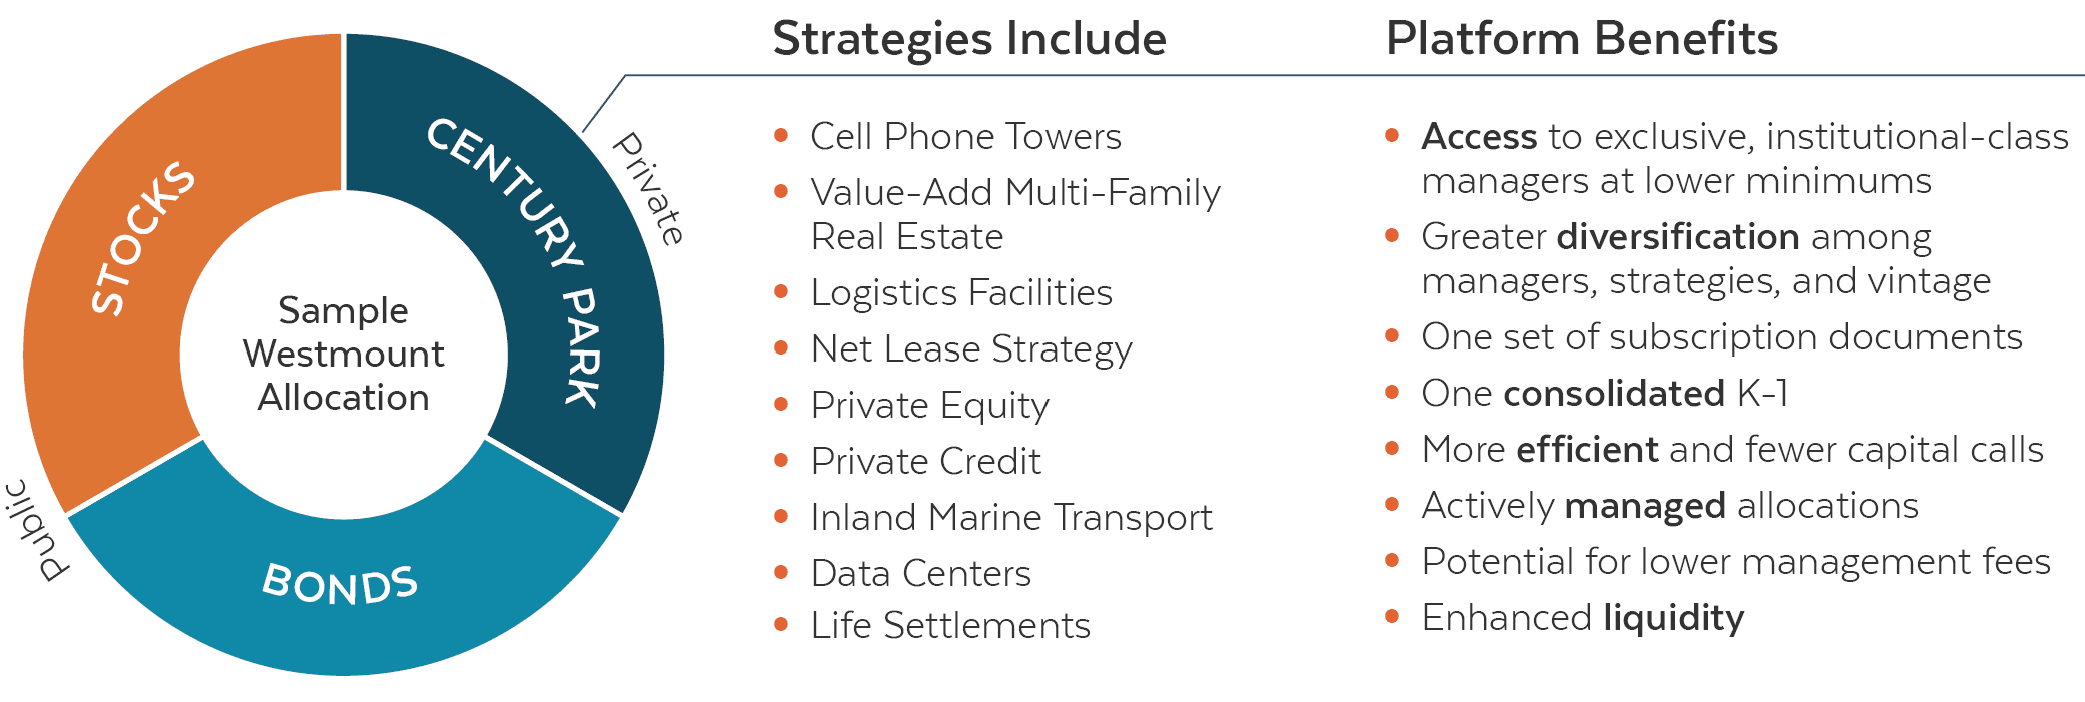
Access Private Markets With Century Park
Century Park is a family of multistrategy private funds available exclusively to Westmount clients. Clients invest alongside the foremost private market managers in niche strategies like private credit, private equity, and real estate.
2024 Private Markets Outlook & Themes
Advanced Planning Topics to Engage Clients
Timely Conversations
- Tax Strategies
- Lifestyle Resources
- Estate Planning
- Business Exit Planning
- Real Estate Transitions
- Concentrated Stock
- Charitable Giving
- Multi-Generational Planning
Sophisticated Solutions
- GRATs, SLATs, IDGTs, QPRTs
- 1031 Exchanges & DSTs
- Multi-Strategy Private Funds
- Options & Hedging Strategies
- Exchange Funds
- Trustee Services
- Customized Reporting
- Donor Advised Funds & CRTs
Westmount’s Planning Team possesses a broad range of expertise in a variety of specialized areas. Advisors hold a number of industry certifications and academic titles, including the CFA®, CFP®, CIPM®, CEPA®, CLU®, CPWA®, CAIA, and JD.


Case studies: Get to know our newest clients
Performance Highlights
Navigating the Markets Following the COVID Meltdown
Dec. 31, 2020 – Dec. 31, 2023
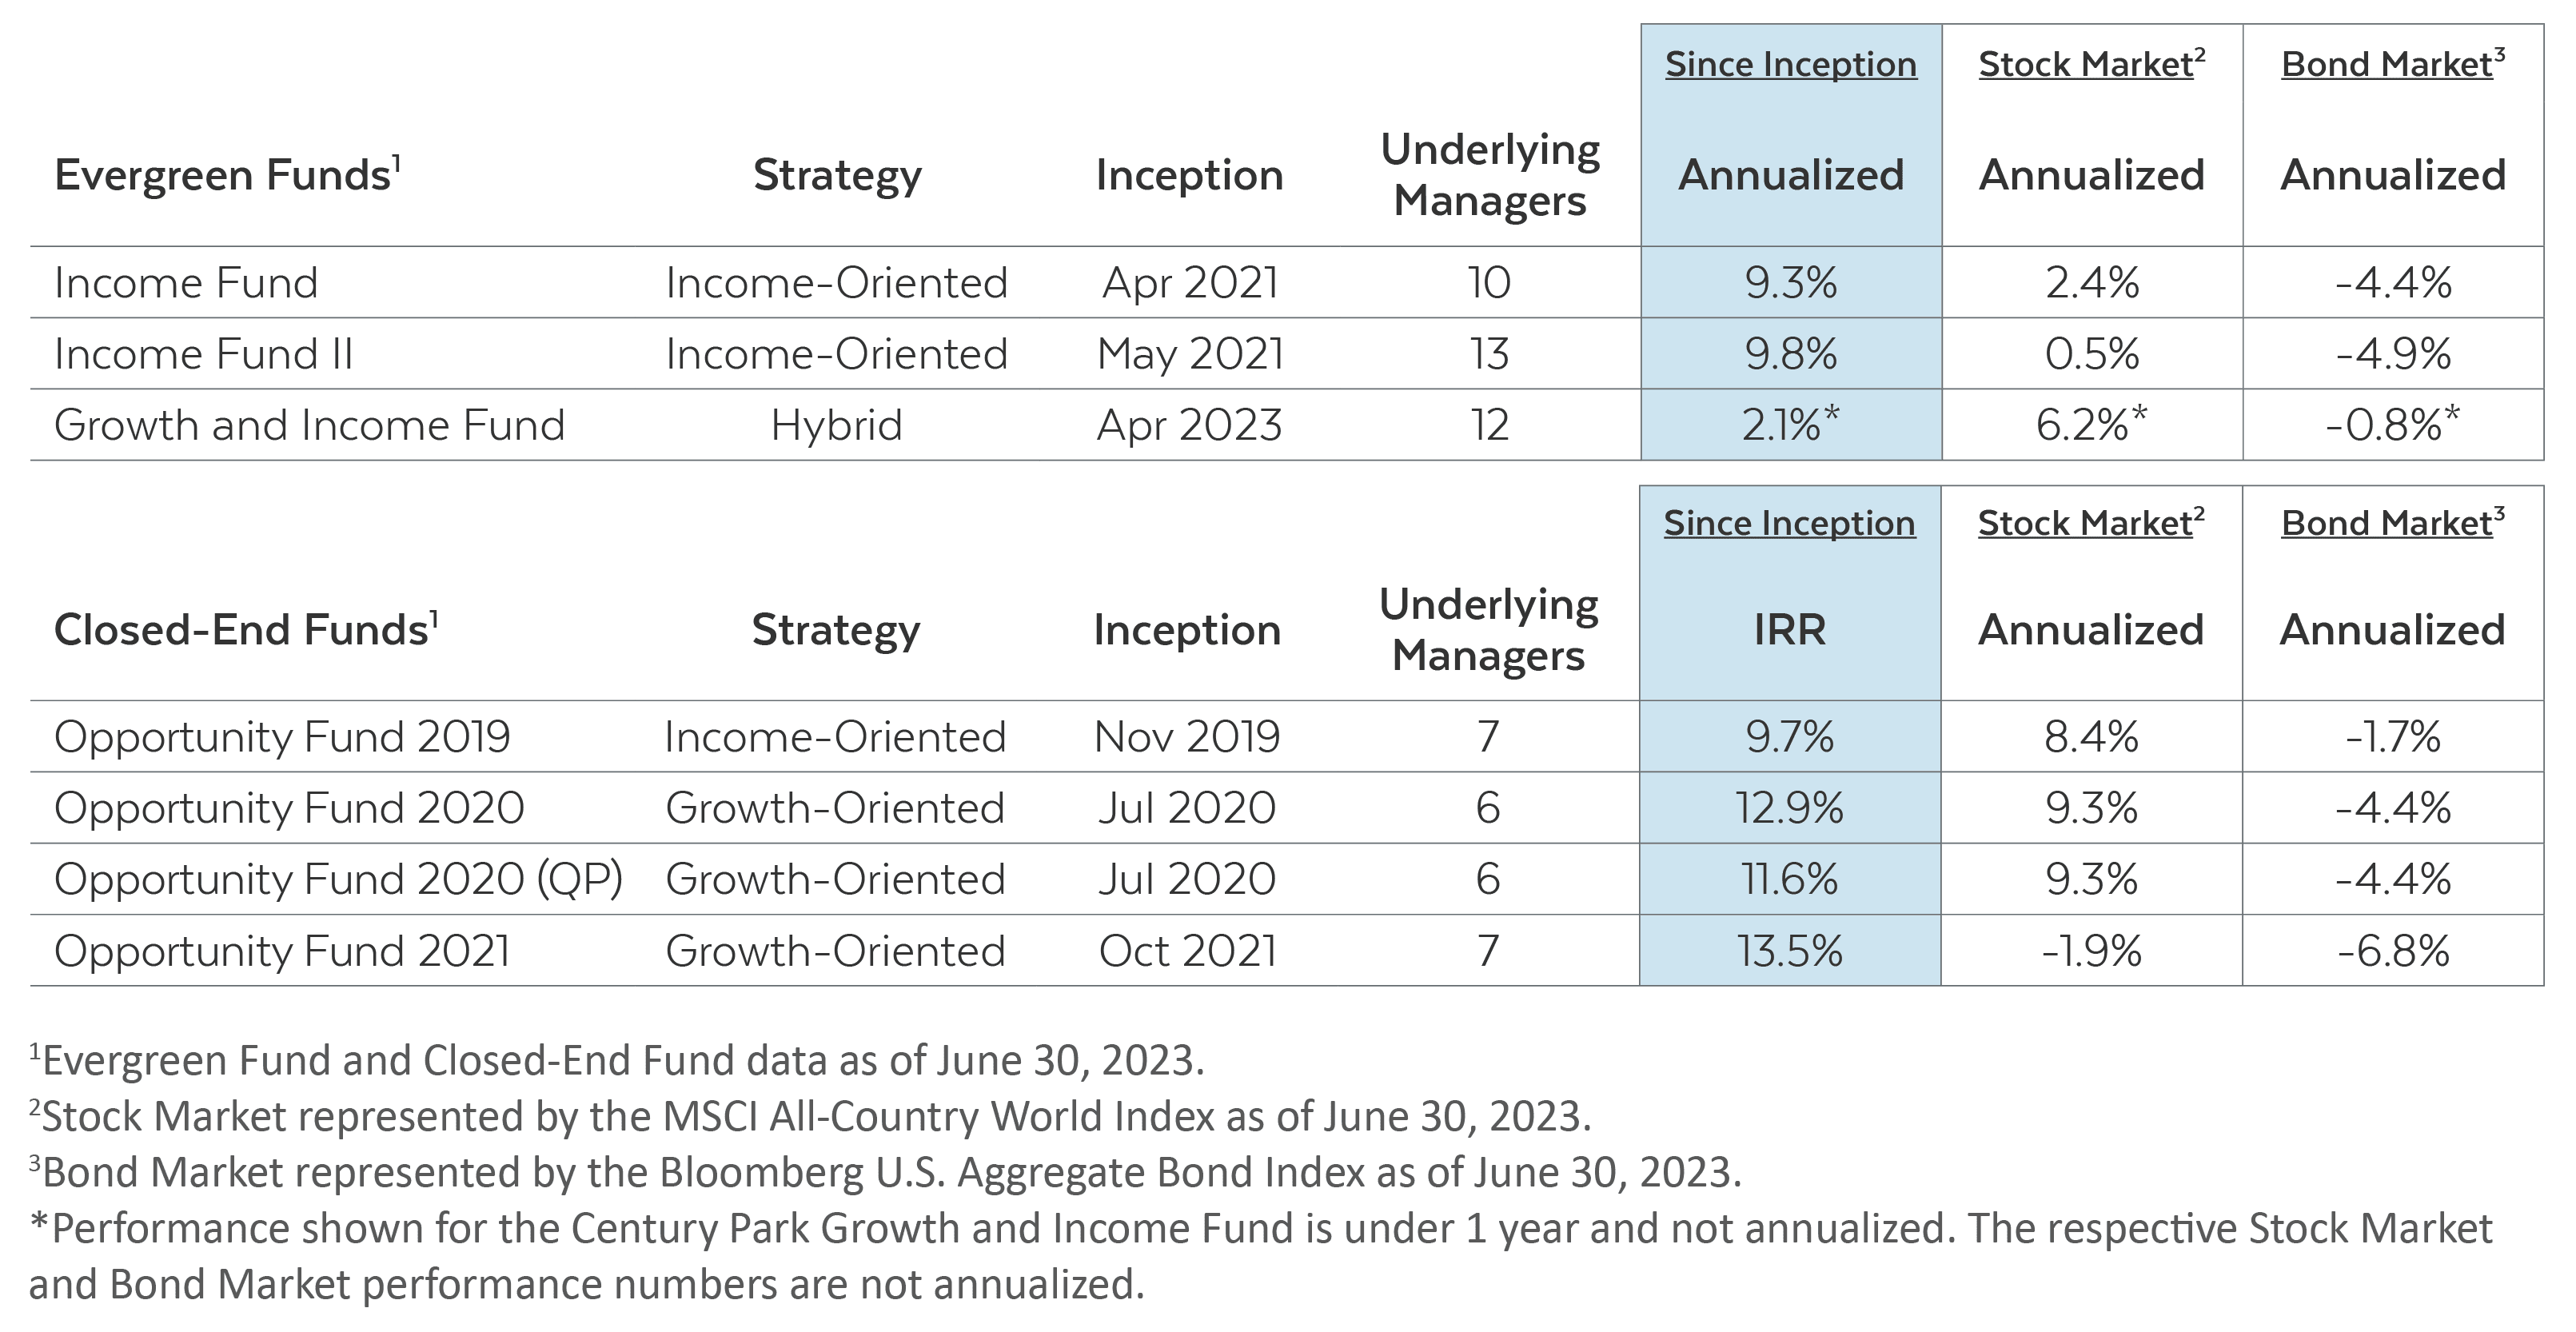
Westmount’s Century Park Private Investment Funds
As of Jun. 30, 2023
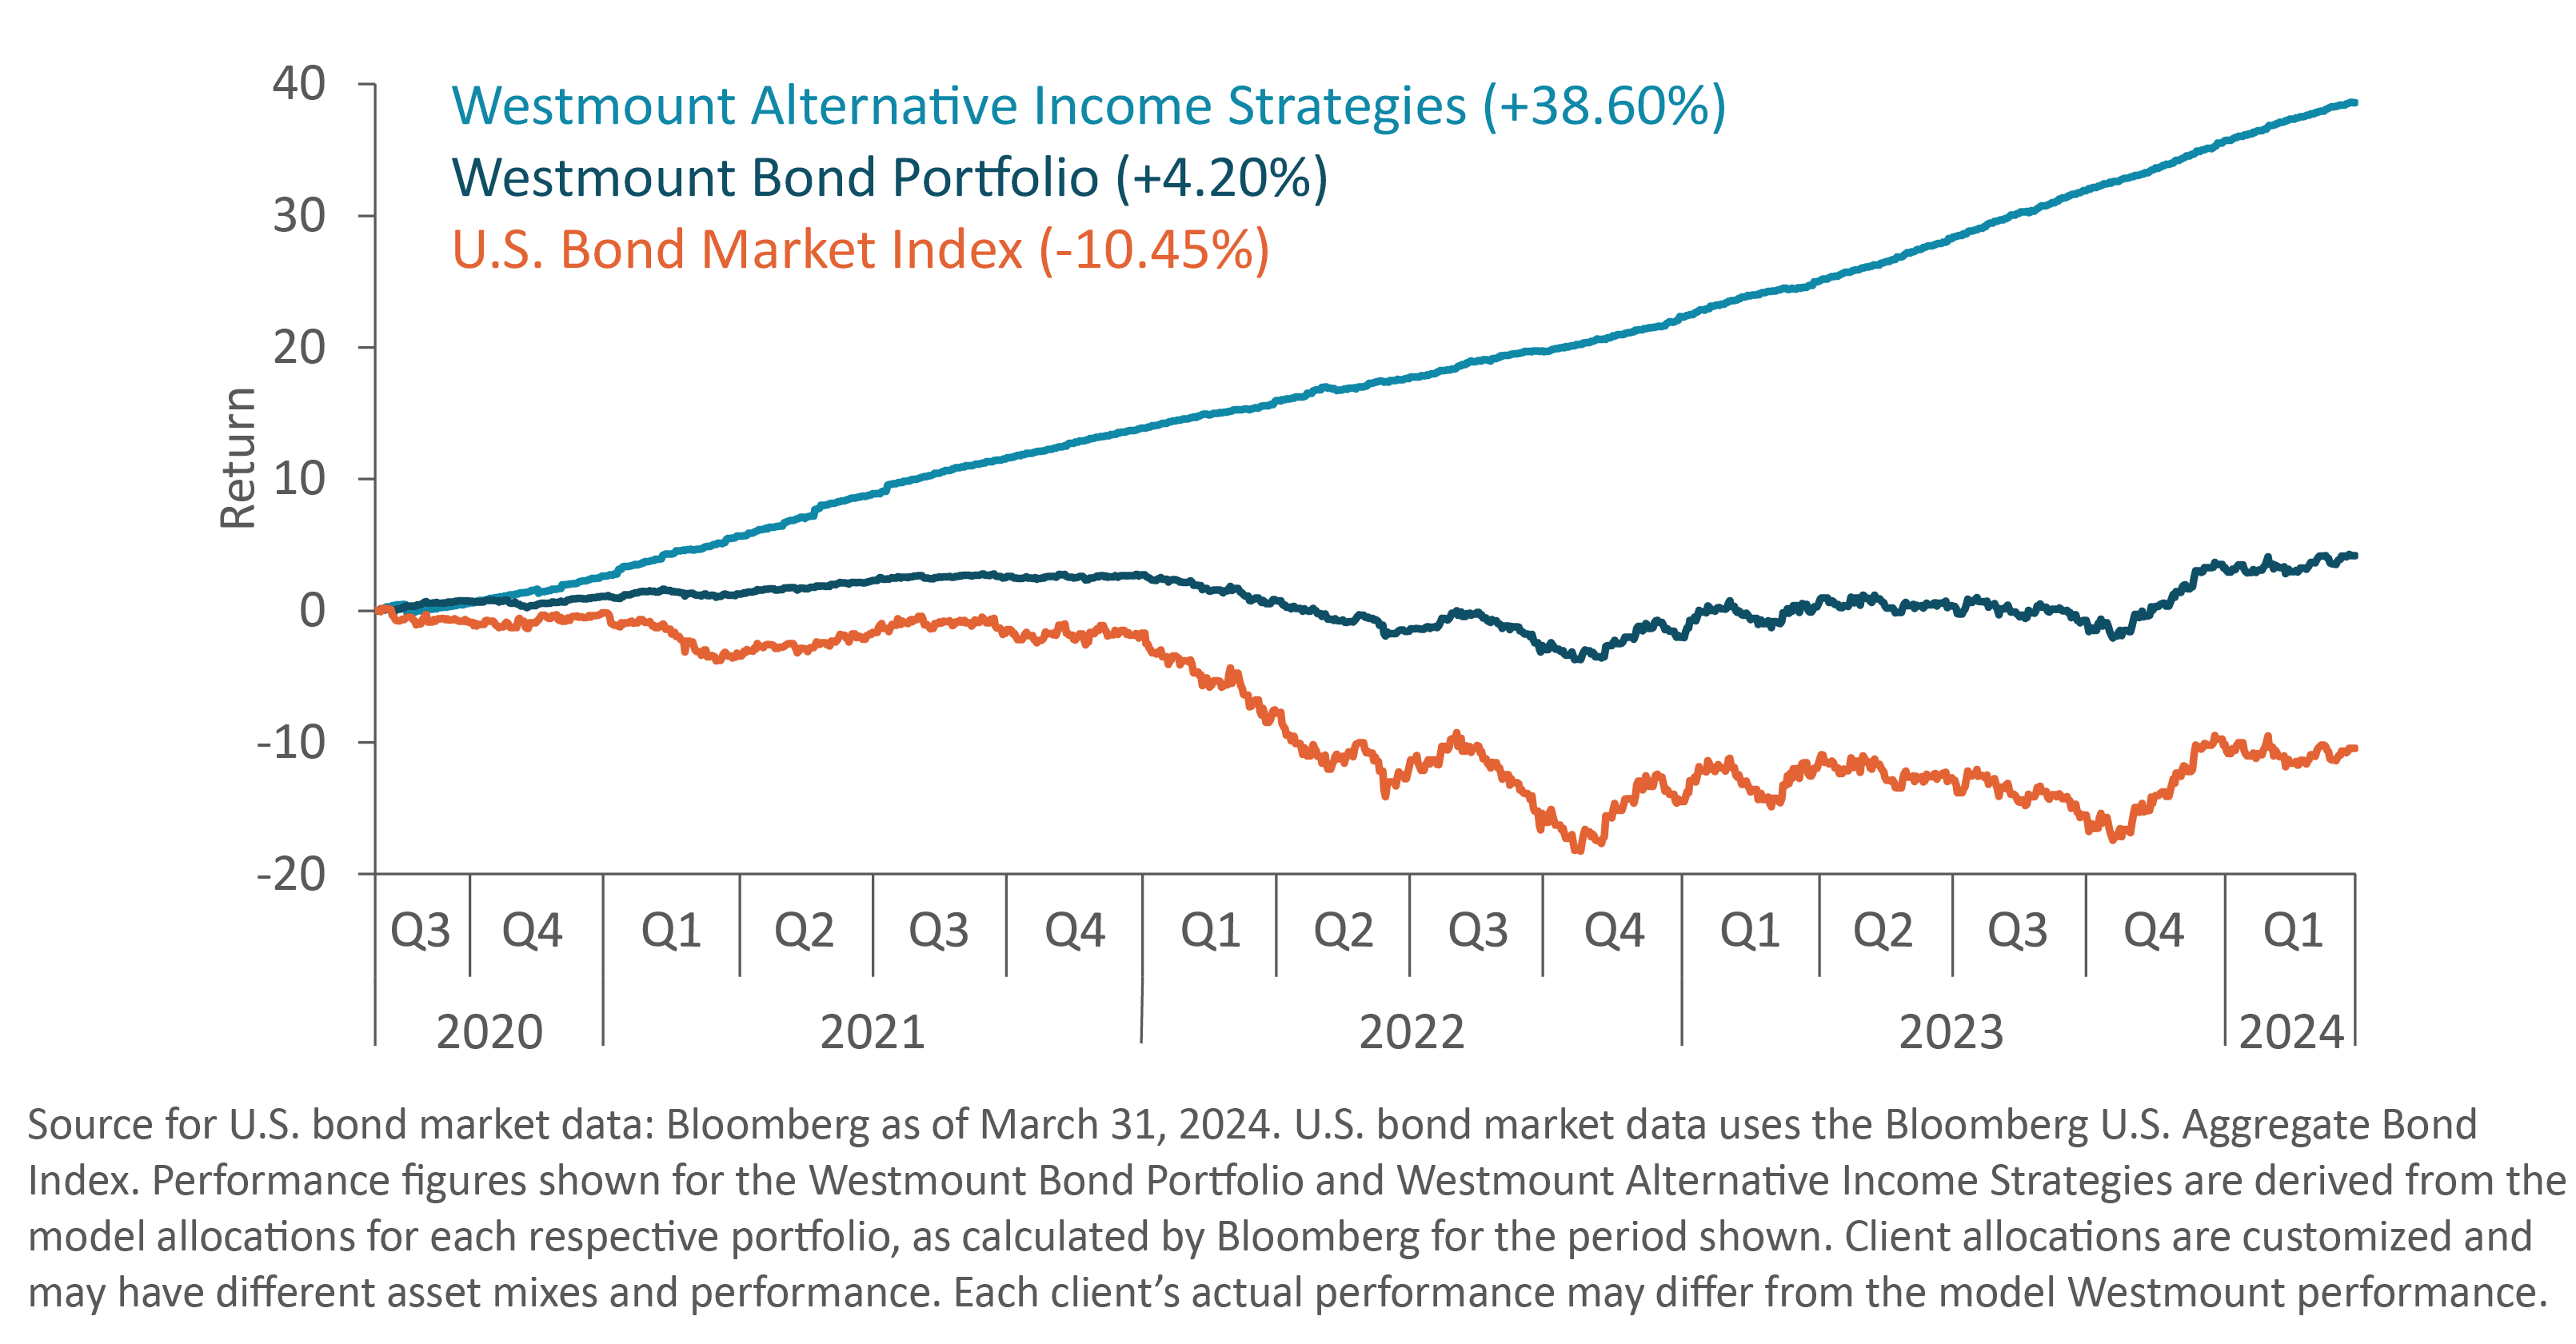
Westmount Income Strategies
Aug. 1, 2020 – Mar. 31, 2024
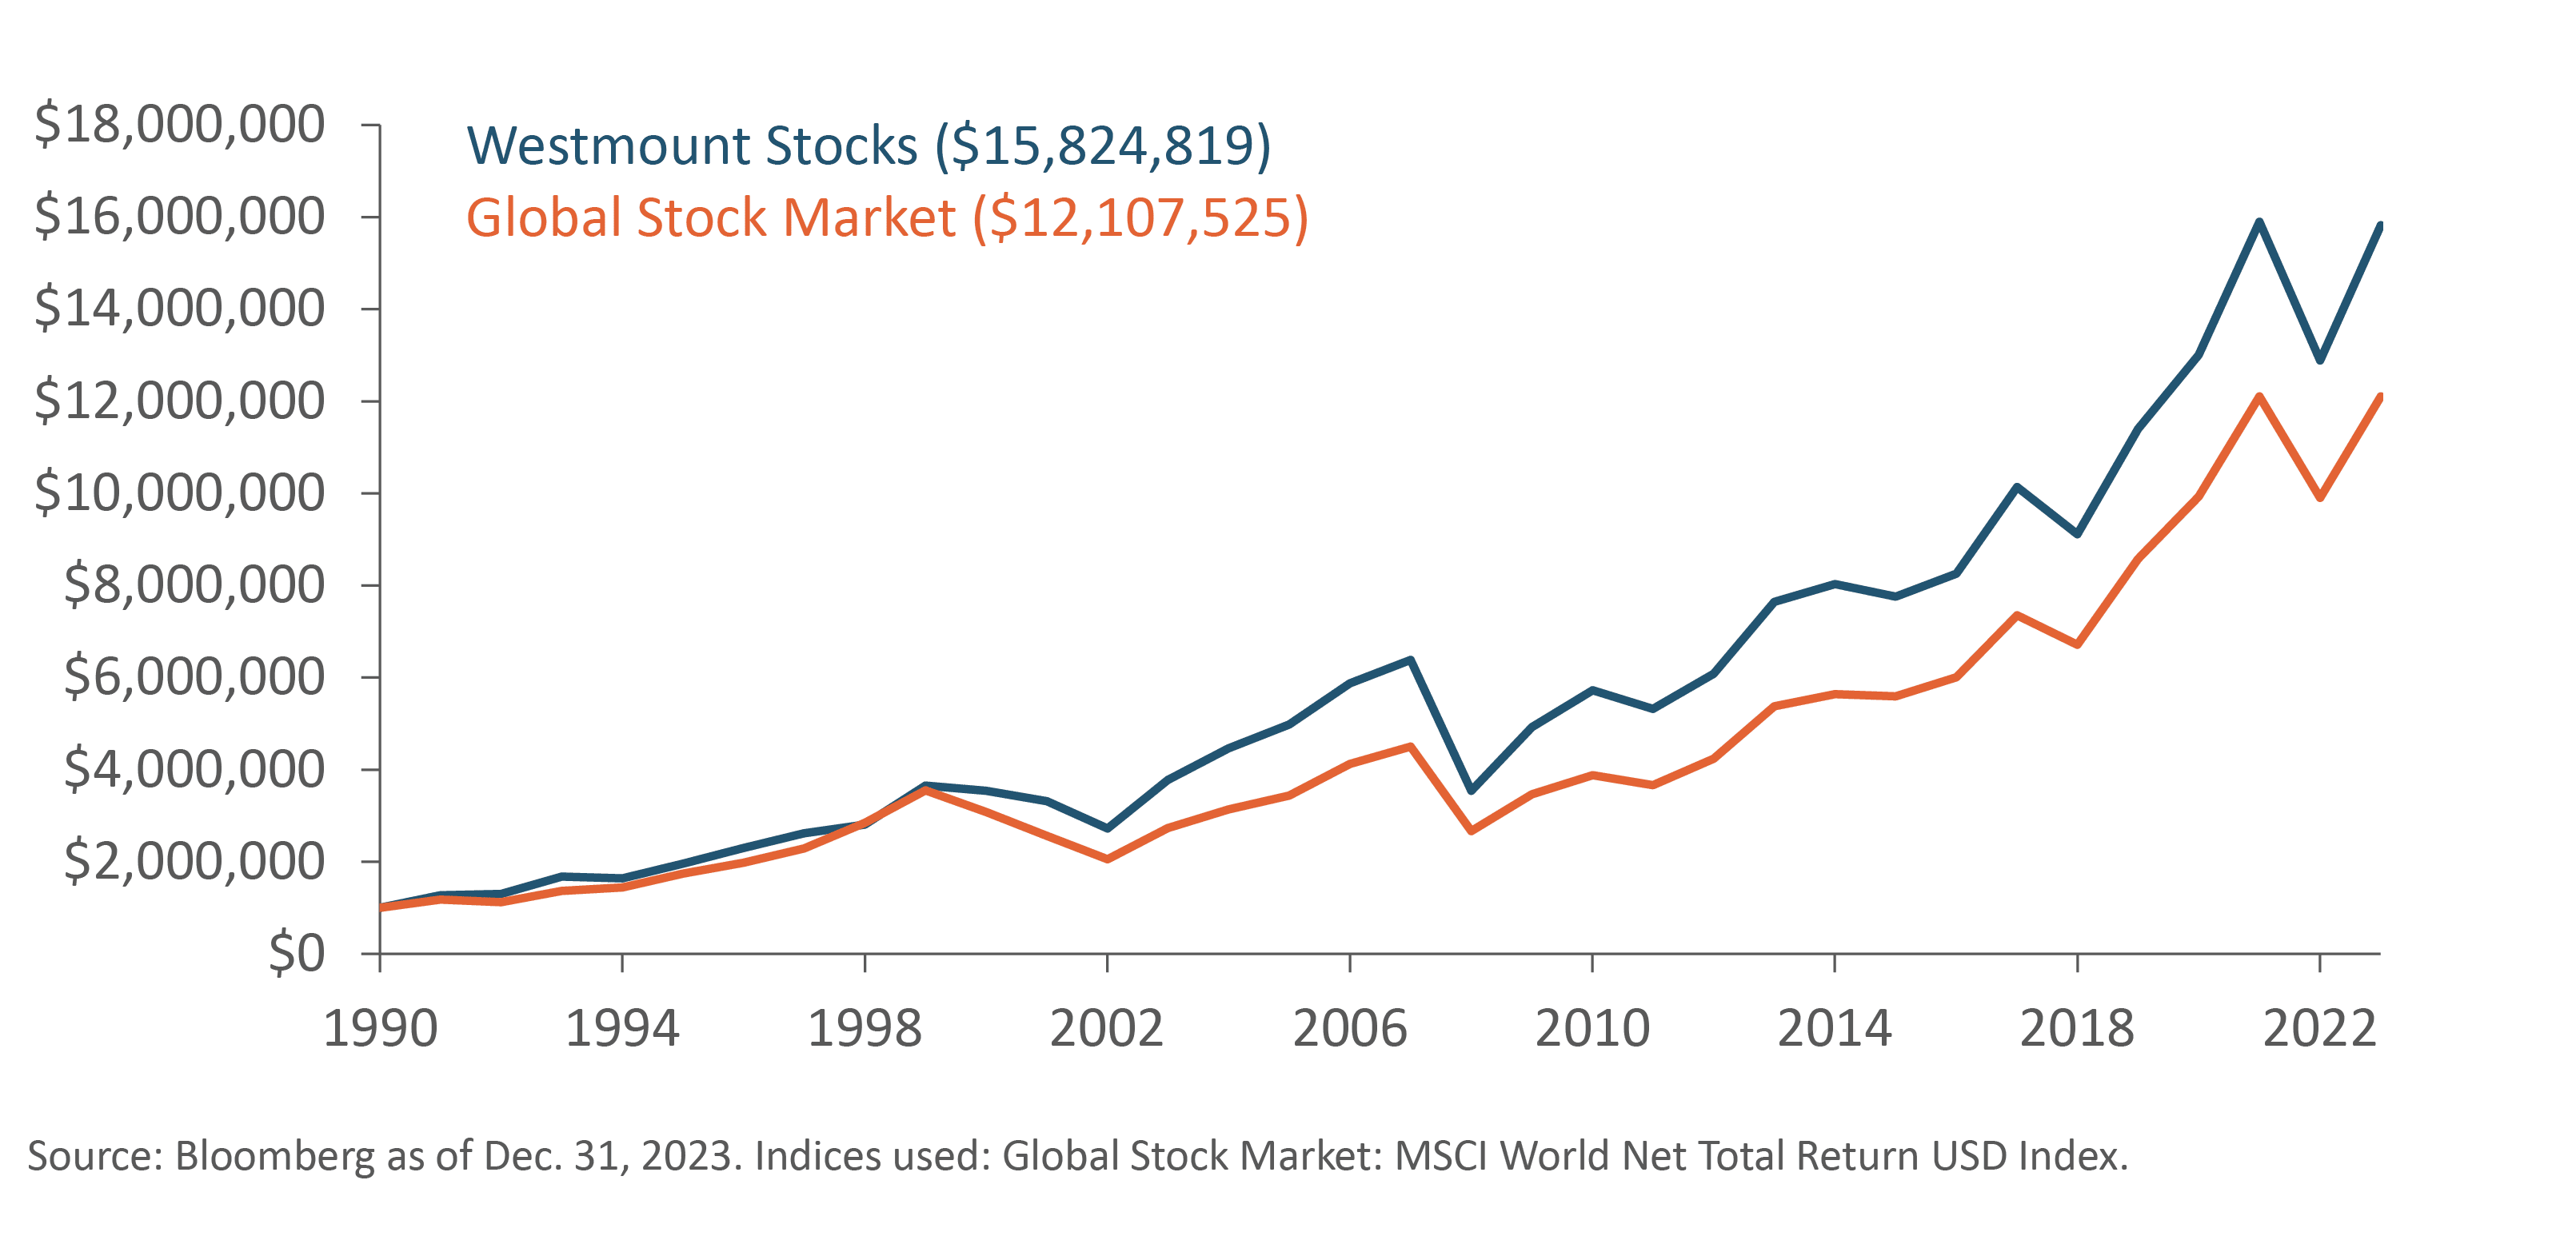
Westmount Stocks: Growth of $1 Million
Aug. 1, 2020 – Dec. 31, 2023
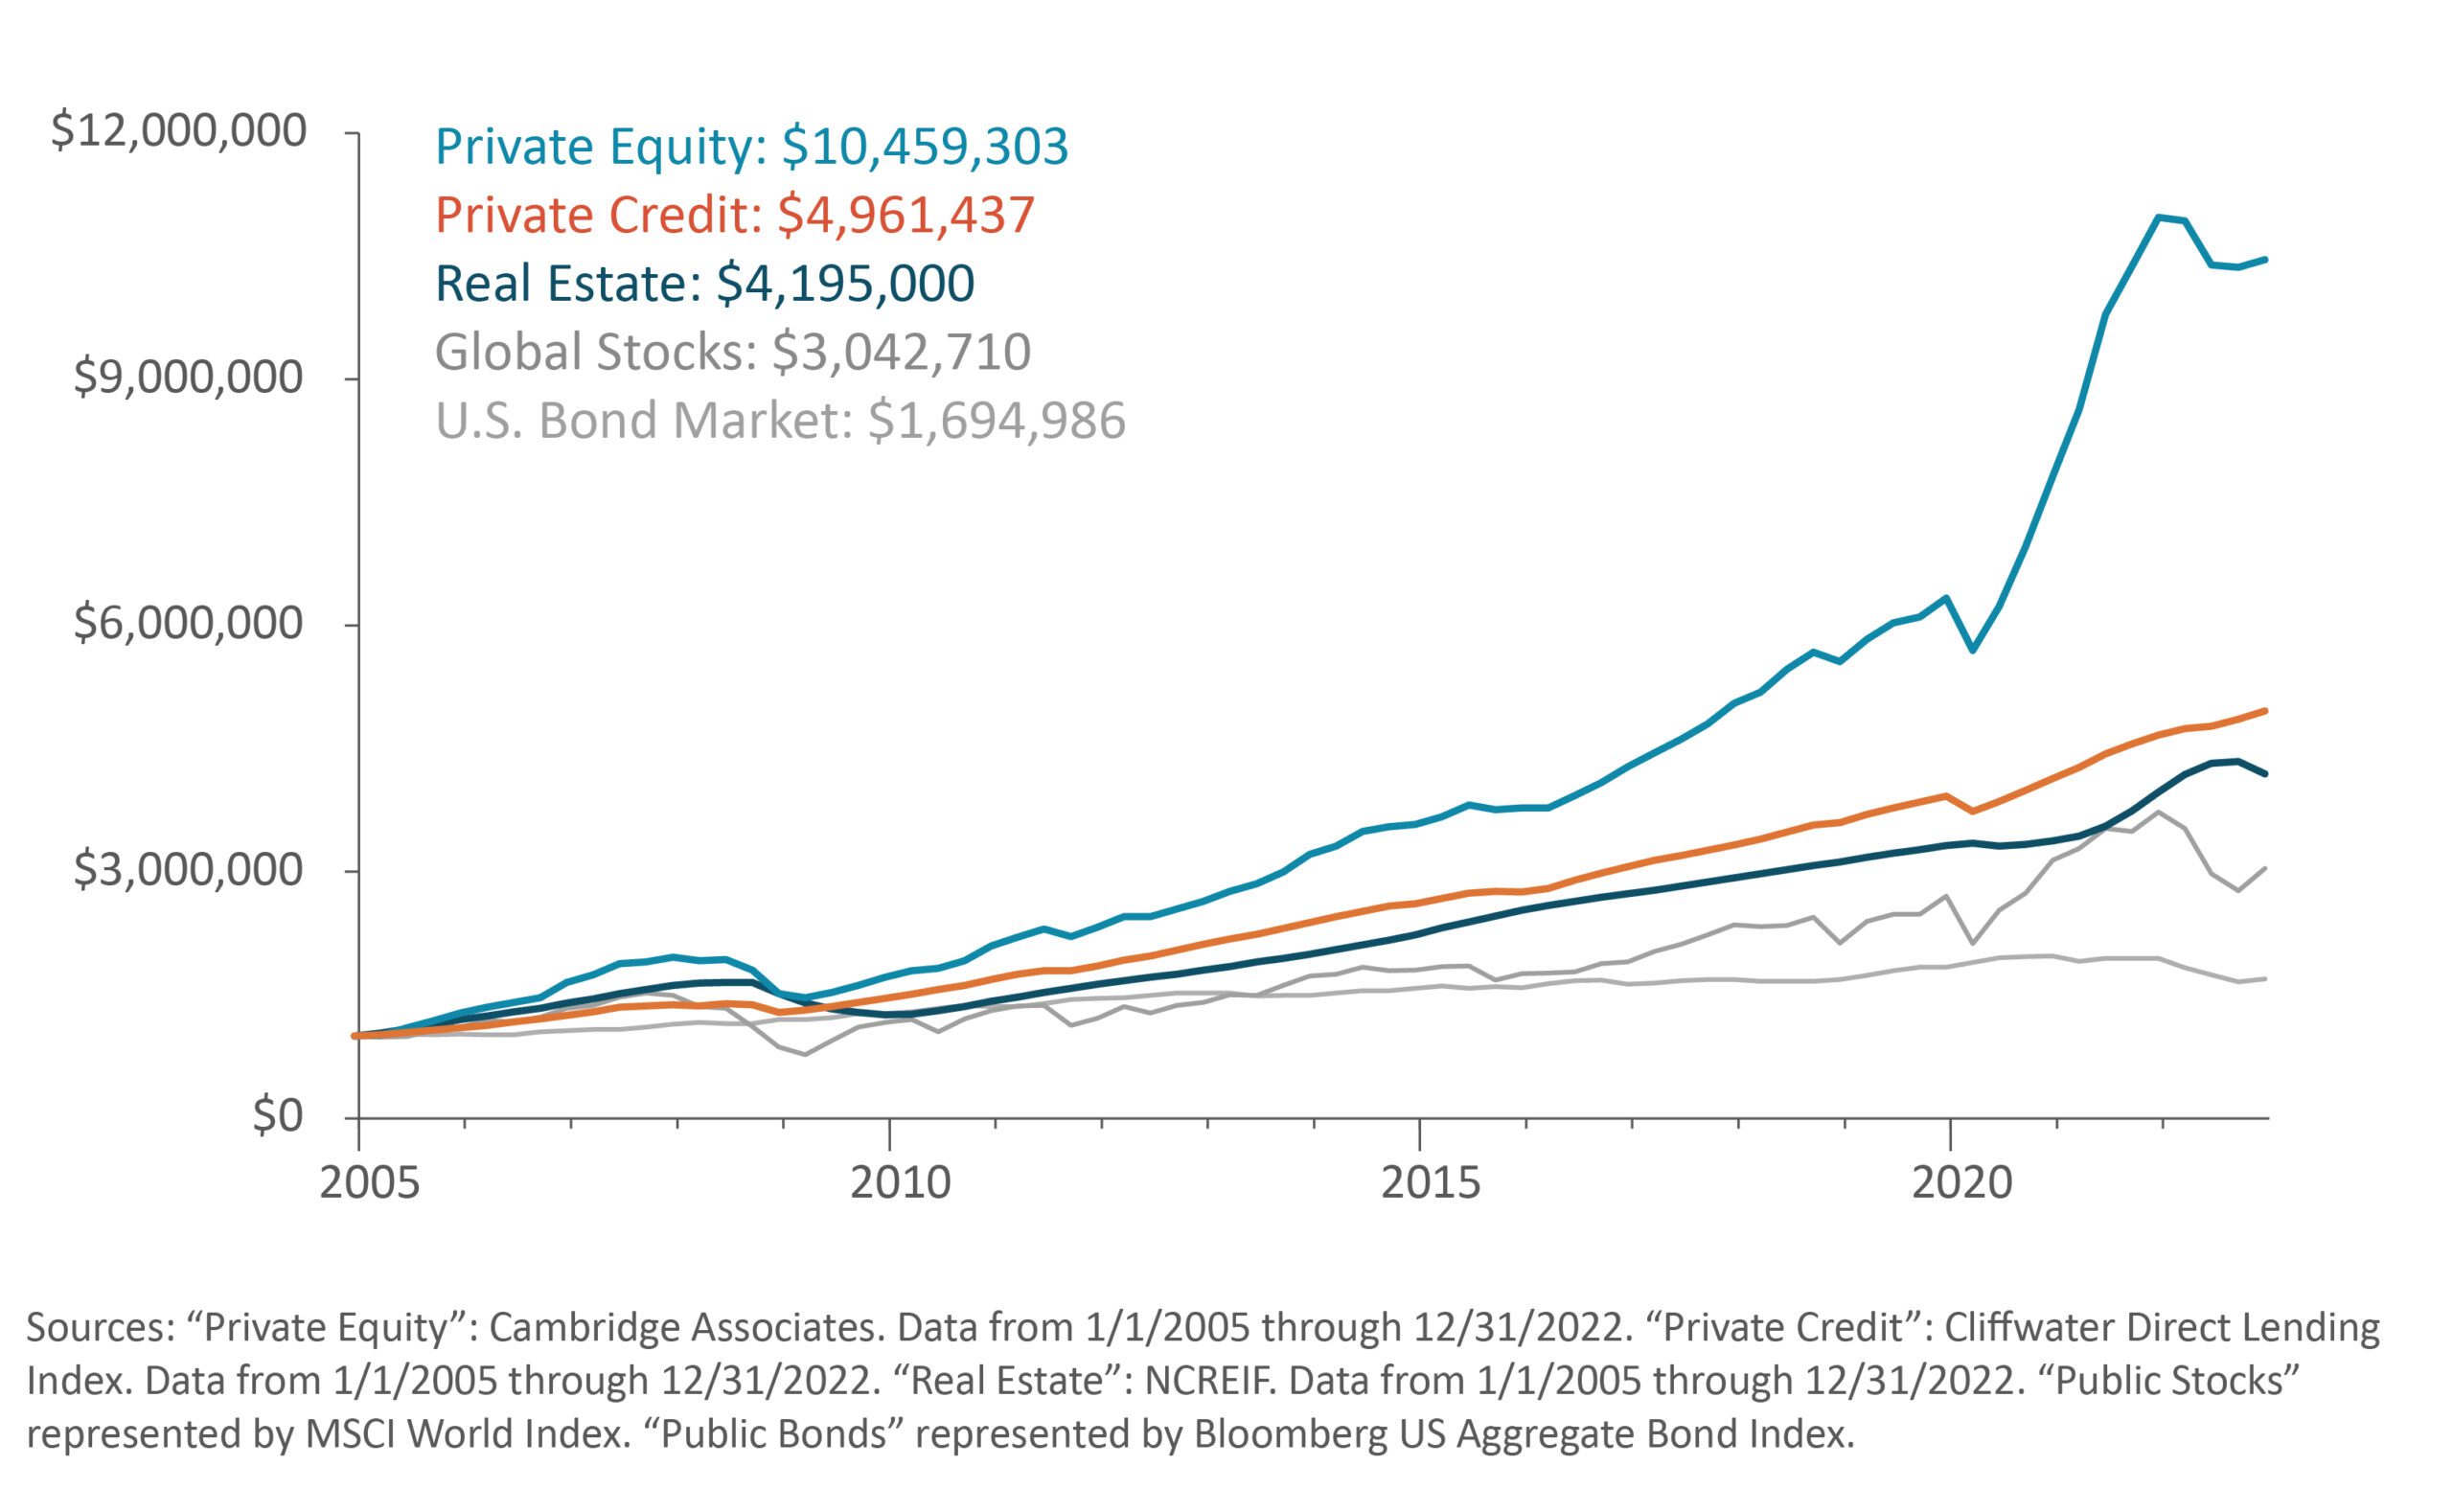
Private vs. Public Market Assets: Growth of $1 Million
Jan. 1, 2005 – Dec. 31, 2022
We want your feedback.
Looking for specific information? Can we improve the consistency and relevance of our communications? Are there any other services or resources that would help you and your clients? Please let us know.
Email sanbox@westmount.com or call 310-556-2502.
This document was prepared by Westmount Partners, LLC (“Westmount”). Westmount is registered as an investment advisor with the U.S. Securities and Exchange Commission, and such registration does not imply any special skill or training. Westmount believes the sources used in this document are reliable, but Westmount does not guarantee their accuracy. The information contained herein reflects subjective judgments, assumptions, and Westmount’s opinion on the date made and may change without notice. Westmount undertakes no obligation to update the contents of this document. It is for information purposes only and should not be used or construed as investment, legal or tax advice, nor as an offer to sell or a solicitation of an offer to buy any security. No part of this document may be copied in any form, by any means, or redistributed, published, circulated, or commercially exploited in any manner without Westmount’s prior written consent.
Navigating the Markets Following the COVID Meltdown
Performance figures shown include the reinvestment of dividends and are net of all investment costs, including Westmount’s advisory fee. The performance figures above reflect the deduction of a 0.58% fee charged by Westmount, which represents the current blended fee rate of Westmount’s aggregate clientele as of December 31, 2023.
Westmount Income Strategies Chart
Source for U.S. bond market data: Bloomberg as of Mar. 31, 2024. U.S. bond market data uses the Bloomberg U.S. Aggregate Bond Index. Performance figures shown are net of all investment costs and reflect the deduction of a 0.59% fee charged by Westmount, which represents the current average blended fee rate of Westmount’s aggregate clientele as of Mar. 31, 2024.
Westmount Stocks: Growth of $1 Million Chart
Source for global stocks data: Bloomberg as of Dec. 31, 2023. Global stock market data uses the MSCI ACWI Index. Performance figures shown are net of all investment costs and reflect the deduction of a 0.58% fee charged by Westmount, which represents the current average blended fee rate of Westmount’s aggregate clientele as of Dec. 31, 2023.
Private vs. Public Market Assets: Growth of $1 Million Chart
Sources for global stocks and U.S. bond market data: Bloomberg as of Dec. 31, 2022. Global stock market data uses the MSCI ACWI Index. U.S. bond market data uses the Bloomberg U.S. Aggregate Bond Index.
The market indices shown are provided to assist clients in evaluating Westmount’s performance relative to the markets in which we invest. You cannot invest directly in an index. Westmount’s portfolios are not intended to perfectly mirror the relevant indices, may have more or less volatility than the indices, and may invest in markets and strategies not represented by any of the indices shown. The indices are unmanaged and do not carry fees or expenses.
Performance figures shown for Westmount Stocks and Westmount Bond Portfolio are derived from the model allocation for each respective portfolio, as calculated by Bloomberg for the period shown. Client allocations are customized and may have different asset mixes and performance. Each client’s actual performance may differ from the model Westmount performance. The blended fee rate varies over time, and in some periods has been higher or lower than the fee rate reflected in this report. Westmount’s fees are described in Part 2A of our Form ADV, which is available upon request.
Performance figures shown for Century Park funds are representative of the expectations for investors in the A share class. They include the reinvestment of dividends and are net of all investment costs, including Westmount’s advisory fee, described above. IRR shown represents the Fund’s composite return since inception, but each individual investor’s IRR may vary based on the timing of their initial investment. There is no assurance that there will be any return of or on invested capital, nor that any forecasts or opinions in this material will be realized. The actual results may differ significantly from the forecast for several reasons, including failure to achieve any of the assumptions underlying such forecast or any number of risk factors including the inability to raise sufficient capital. The strategies described in this presentation are non-traditional approaches to investing and may contain significant risk.
The material contained herein is confidential, furnished solely for the purpose of considering an investment in The Century Park Growth & Income Fund (herein referred to as “the Fund”). Summaries contained herein of any documents are not intended to be comprehensive statements of the terms of such documents, but rather only outlines of some of the principal provisions contained therein. Westmount shall not be liable for any damages arising out of any inaccuracy in the information. The material herein is subject to change. Each potential investor, by accepting delivery of this presentation, agrees not to use, or make a photocopy or other copy, or to divulge the contents hereof to any person other than a legal, business, investment or tax advisor in connection with obtaining the advice of such person with respect to this offering as to legal, tax, and related matters.
Client retention rate shown is for clients with $2 million or more in managed assets on the date of termination, as of Dec. 31, 2023.
*Total Return refers to the cumulative return since the inception of each fund.
**Average Return refers to the annual internal rate of return or time-weighted annualized return where applicable.
This information is not intended to be legal, tax, business, or financial advice. Please consult with your applicable professional for such advice. If you have any comments or questions about this webpage, please contact us at info@westmount.com.