The Fed’s role in guiding the economy – and ours in guiding client portfolios Market Review by Terrence Demorest, Chief Investment Officer – Public Markets and ESG
Market Review by Terrence Demorest, Chief Investment Officer – Public Markets and ESG
The Fed’s Moves
When the global pandemic hit in 2020, the Federal Reserve Bank moved quickly and decisively to stimulate an uncertain economy by cutting interest rates to near zero, creating much-needed liquidity in the monetary system.
These moves, however—combined with unprecedented federal fiscal stimulus, supply chain disruptions, and demand surges for many products and services—created levels of inflation not seen in decades.
Once the economy regained its footing, the Fed moved aggressively in the opposite direction, raising interest rates as part of its steadfast efforts to subdue inflation. As the chart below reveals, the Fed has hiked rates a total of 11 times since March 2022, raising short-term rates by 5.25%.
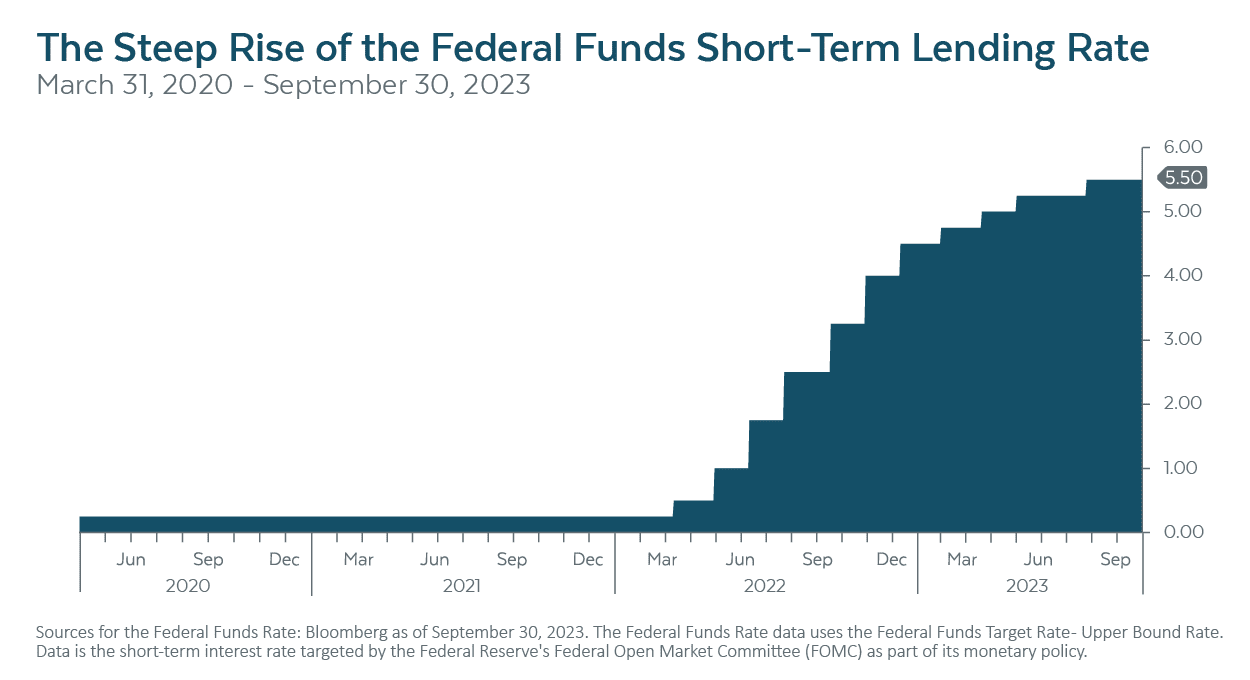
While this sharp rise in interest rates has largely succeeded in bringing down inflation to near-acceptable levels, it has also wreaked havoc on the financial markets: stocks fell -18.0% in 2022 before rebounding this year. Bonds, meanwhile, fell -13.0% in 2022 (their worst year ever) and presently remain in negative territory.
The pivotal question currently revolves around the Fed’s possible future course of action: will it continue raising interest rates to bring inflation to acceptable and sustainable levels, maintain current high rates for an extended period to be sure it has slain inflation, or implement rate reductions in response to a deteriorating economy?
While the Fed’s next move and the direction of the economy cannot be predicted with any certainty, the continued strength of the economy (and of the labor market in particular) makes a rate reduction unlikely any time soon. Rather, we view the prospect of “higher rates for longer”—coupled with at least one more rate increase—as the most likely scenario to play out.
Your Alternative Asset Portfolios
Similarly, our alternative asset holdings have thrived through this period of rising rates. In recent years, this portion of client portfolios has concentrated on high-income investments in corporate and real estate loans backed by tangible assets.
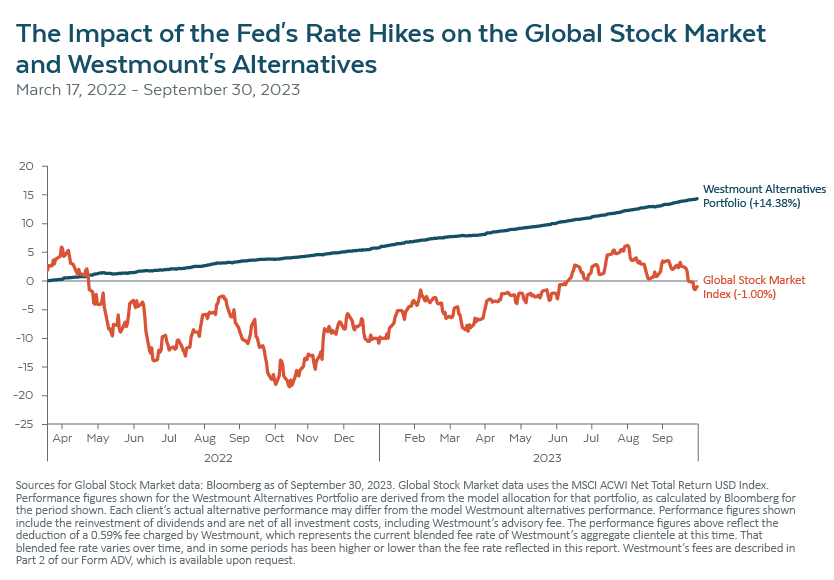 These loans often have variable interest rates, which means that as interest rates increase, investors receive more income (and the underlying loans typically retain their value when rates rise, unlike fixed-rate bonds).
Since the Federal Reserve embarked on its interest rate hike campaign in March 2022, our alternatives portfolio has soared by +14.38%, while the global stock market experienced a decline of -1.00%.
Your Bond Portfolios
In response to the massive dislocations caused by the pandemic, we strategically repositioned our bond portfolio over the past 3 ½ years to look and perform very differently from the broader bond market. Anticipating high inflation and an eventual rate hike, we tailored our bond holdings to have a much more short-term focus.
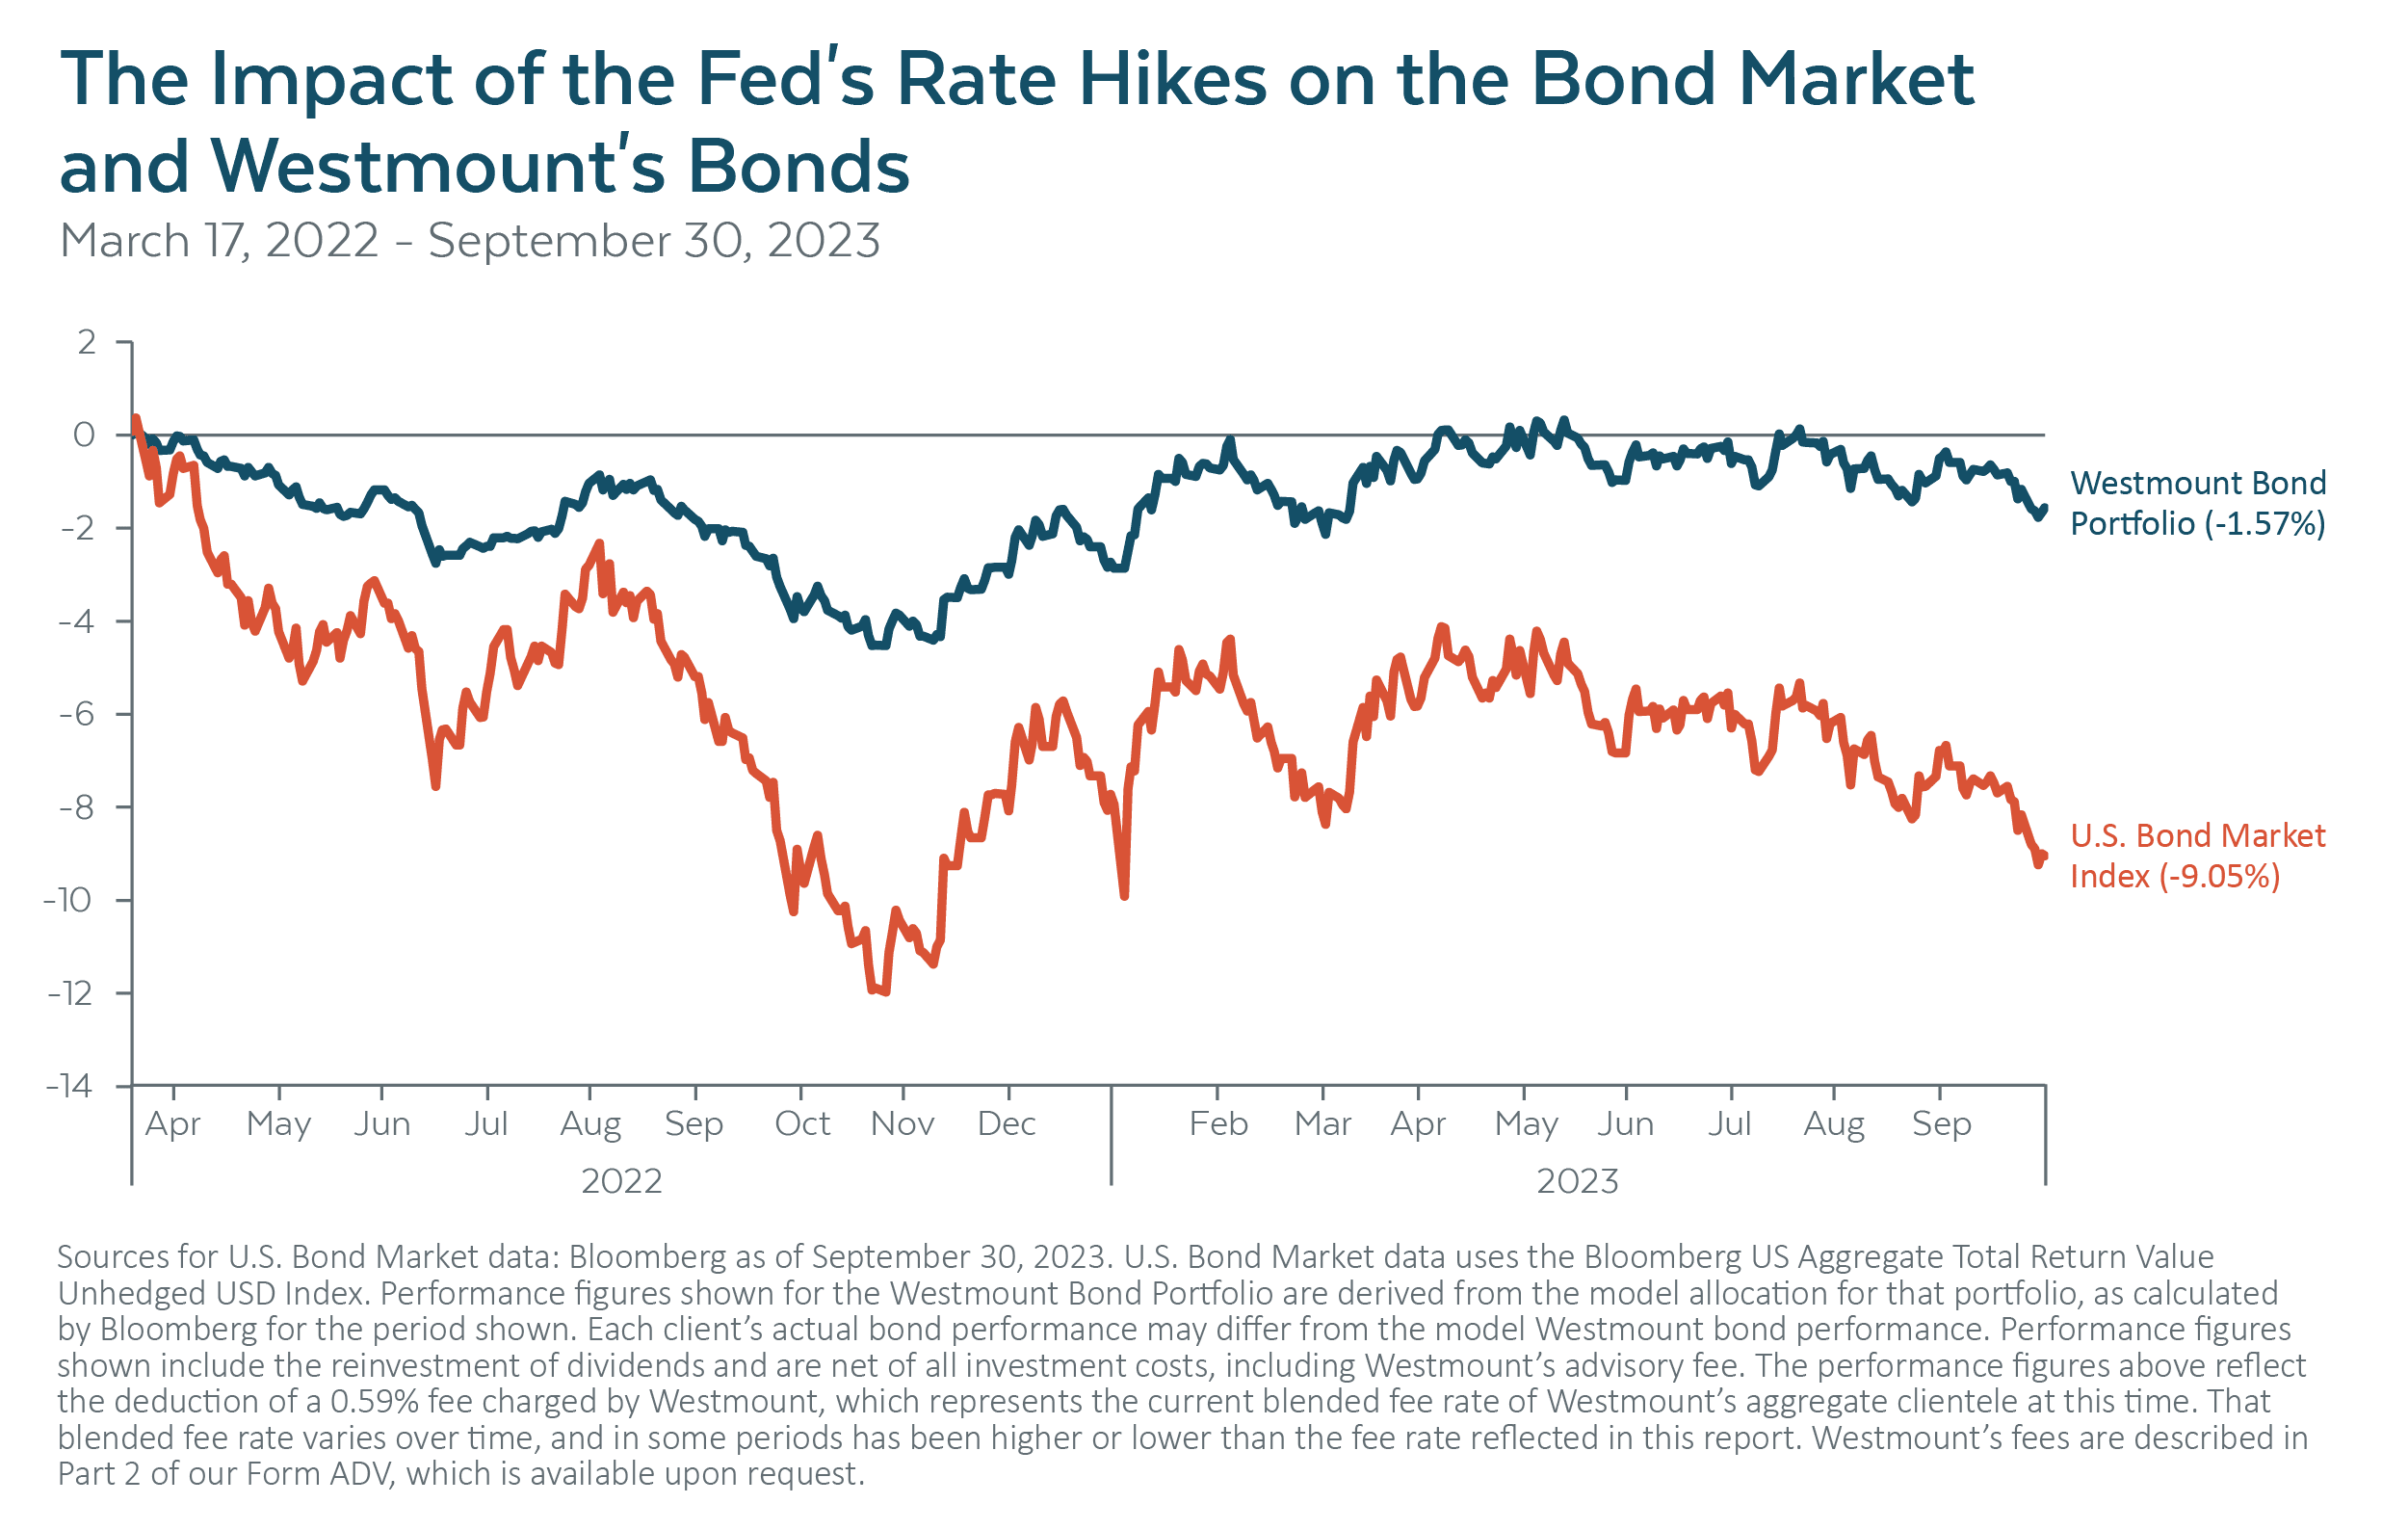 Knowing that rising interest rates typically produce declines in bond values, especially for longer-term bonds, we augmented our short-term emphasis with selective investments in corporate credit from companies that are well-equipped to thrive in a rising interest rate environment.
Since the Federal Reserve began its campaign to raise interest rates in March 2022, Westmount’s bond portfolio has resoundingly outperformed the bond market by +7.48% over the same period.
Recent posts
Disclosures
This report was prepared by Westmount Partners, LLC (“Westmount”). Westmount is registered as an investment advisor with the U.S. Securities and Exchange Commission. The information contained in this report was prepared using sources that Westmount believes are reliable, but Westmount does not guarantee its accuracy. The information reflects subjective judgments, assumptions and Westmount’s opinion on the date made and may change without notice. Westmount undertakes no obligation to update this information. It is for information purposes only and should not be used or construed as investment, legal or tax advice, nor as an offer to sell or a solicitation of an offer to buy any security. No part of this report may be copied in any form, by any means, or redistributed, published, circulated or commercially exploited in any manner without Westmount’s prior written consent.
Performance figures shown include the reinvestment of dividends and are net of all investment costs, including Westmount’s advisory fee. The performance figures above reflect the deduction of a 0.59% fee charged by Westmount, which represents the current average blended fee rate of Westmount’s aggregate clientele at this time. That blended fee rate varies over time, and in some periods has been higher or lower than the fee rate reflected in this report. Clients may have a higher or lower rate depending on their portfolio. Westmount’s fees are described in Part 2 of our Form ADV, which is available upon request.
The market indices shown are provided to assist clients in evaluating Westmount’s performance relative to the markets in which we invest. You cannot invest directly in an index. Westmount’s portfolios are not intended to perfectly mirror the relevant indices, may have more or less volatility than the indices, and may invest in markets and strategies not represented by any of the indices shown. The indices are unmanaged and do not carry fees or expenses.
If you have any comments or questions about this article, please contact us at info@westmount.com.