Stocks, alternatives continue their upward momentum as the bond market struggles Market Review from the Westmount Investment Team
Market Review from the Westmount Investment Team
12 July 2024
![]()
After a rocky start to the second quarter, stocks regained their momentum from Q1 as healthy corporate earnings and economic data eased fears of an impending recession. The Federal Reserve’s signals about potential rate cuts later in the year, contingent on cooling inflation, further boosted stock returns here and abroad. The bond market realized slight gains in the quarter as it digested strong growth forecasts alongside the Fed’s outlook on short-term rates.
Stocks
Driven by a strong earnings season, especially within the technology and consumer discretionary sectors, the global stock market shook off early-quarter inflation concerns to reach all-time highs.
Despite the Fed’s continued hawkish stance on inflation, the market projected one or two more rate cuts by year-end. Markets rallied off these projections to finish the quarter at record levels, highlighting investor optimism and confidence in sustained economic growth.
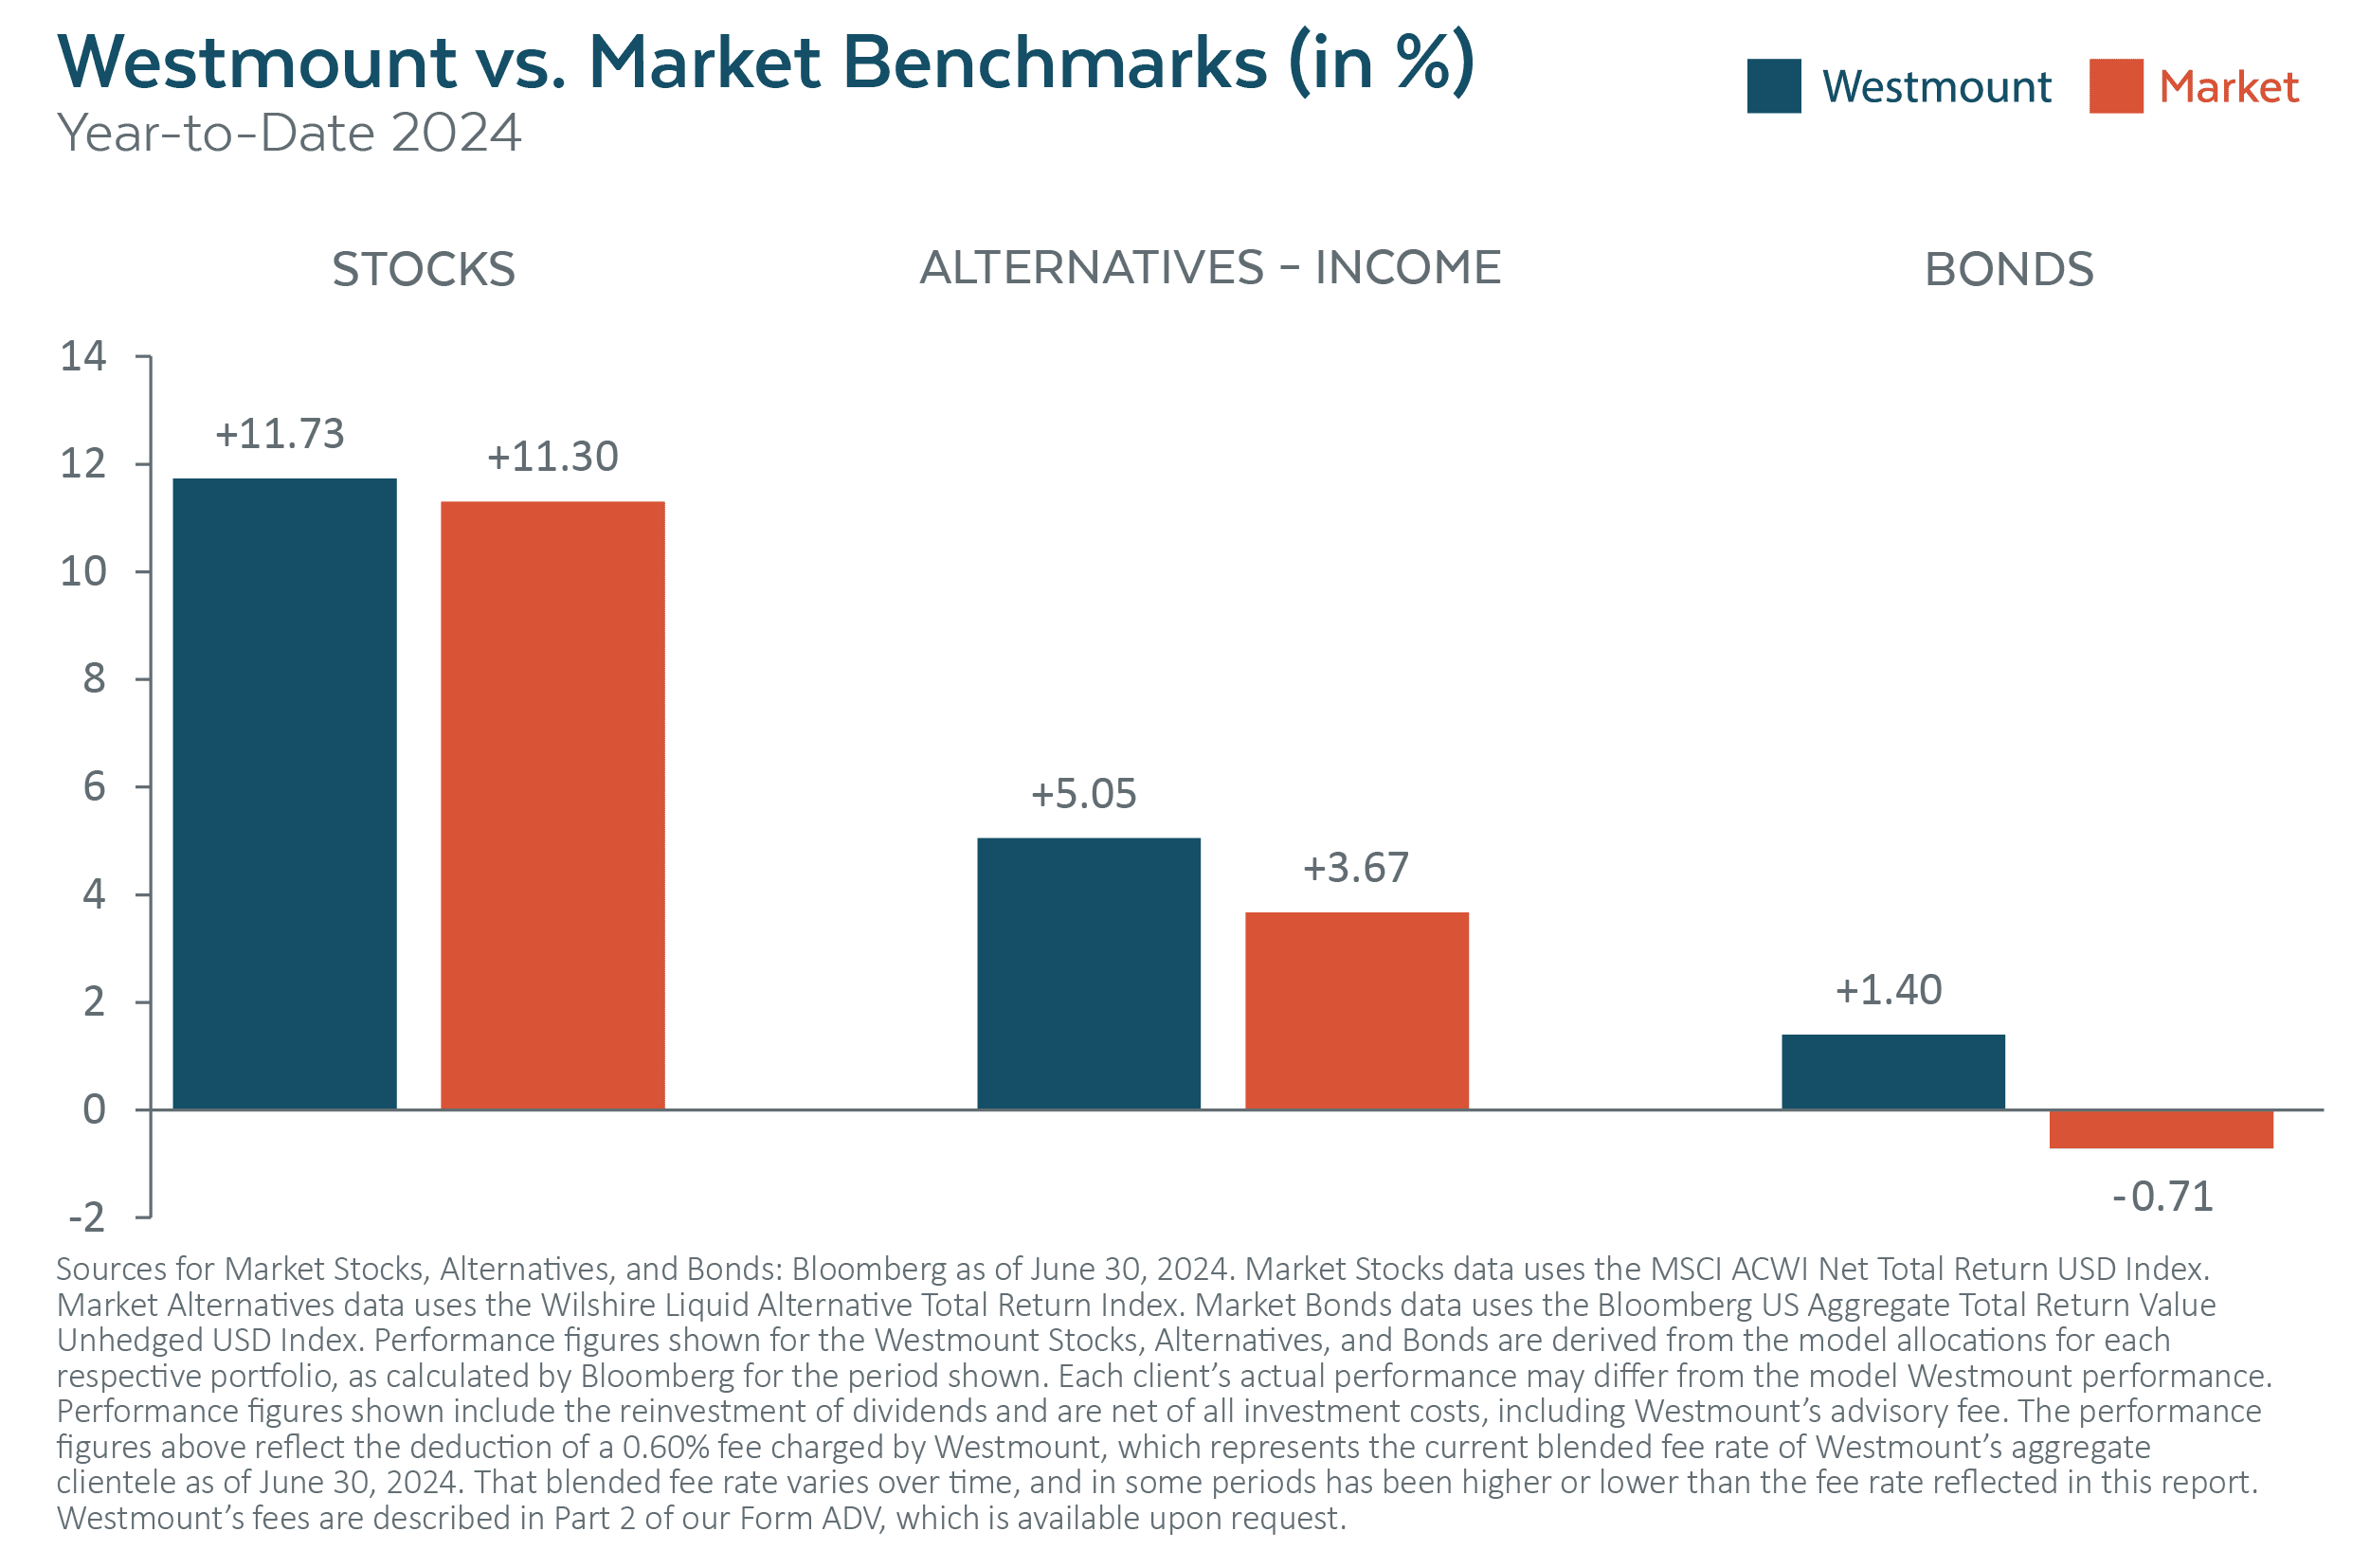
Led by U.S. technology companies and large-cap stocks overall, Westmount’s stock portfolio was up +2.79%1, performing right in line with the global stock market, which gained +2.87%. As of midyear, Westmount’s client stock portfolios—designed to track the markets in a low-cost, tax-efficient, and diversified manner—have outperformed the global stock market, up +11.73%1 compared to the MSCI All Country World Index’s +11.30%.
Alternatives
Inflation and rate concerns have not prevented our high-income strategies from continuing to deliver strong and steady returns. Our Alternatives – Income portfolio provides diversified exposure to private credit (corporate and real estate loans backed by tangible assets). It became even more diversified during the quarter with the addition of the AMG Pantheon Credit Solutions Fund (PCSZX).
AMG Pantheon is not an originator of loans; rather, it purchases existing loans in the secondary market at discounted prices. This allows for increased price appreciation potential and diversification in our alternative portfolio. For the quarter, the Alternatives – Income allocation was up +2.79%1, outperforming the Wilshire Liquid Alternative – Total Return Index, which was up +0.49%. Year-to-date, Alternatives – Income has returned +5.05%1 with little-to-no volatility, while the Wilshire Index is up +3.67%.
In addition, we’ve expanded our clients’ alternatives portfolio this quarter to include a new growth-focused category titled Alternatives – Growth. This segment currently features a private equity fund with a current focus on secondaries, which we discussed in last quarter’s Quarter Notes. That fund is off to a spectacular start, up +13.4%1 in the second quarter.
Bonds
The U.S. bond market has delivered poor performance over the past 47 months, making it by far the longest bond bear market in history. Sharply rising interest rates have turned what was once a stable asset class into one in which investors must be nimble to extract better returns.
That said, future bond returns should be more positive and respectable now that rates have risen so much and are likely at the high point in this cycle. Readers of Quarter Notes over the past few years know we have navigated this minefield well, producing positive returns by positioning the bond portfolio to have considerably less interest rate sensitivity than the overall bond market, while also selecting credit exposure to avoid defaults.
Still, the second quarter was a struggle for the bond markets as interest rates rose on concerns about the delay in the Fed beginning to lower rates. Overall, Westmount’s bond portfolio continued to outperform the bond market, up +0.80%1 in Q2, while the U.S. bond market eked out a positive return of +0.07%. Year-to-date, Westmount’s bonds have produced a strong relative return, up +1.40%,1 while the bond market has struggled, falling -0.71%.
Recent posts
Disclosures
This report was prepared by Westmount Partners, LLC (“Westmount”). Westmount is registered as an investment advisor with the U.S. Securities and Exchange Commission, and such registration does not imply any special skill or training. The information contained in this report was prepared using sources that Westmount believes are reliable, but Westmount does not guarantee its accuracy. The information reflects subjective judgments, assumptions and Westmount’s opinion on the date made and may change without notice. Westmount undertakes no obligation to update this information. It is for information purposes only and should not be used or construed as investment, legal or tax advice, nor as an offer to sell or a solicitation of an offer to buy any security. No part of this report may be copied in any form, by any means, or redistributed, published, circulated or commercially exploited in any manner without Westmount’s prior written consent. Past performance is not an indication of future results.
1Performance figures shown include the reinvestment of dividends and are net of all investment costs, including Westmount’s advisory fee. The performance figures above reflect the deduction of a 0.60% fee charged by Westmount, which represents the current average blended fee rate of Westmount’s aggregate clientele as of June 30, 2024. That blended fee rate varies over time, and in some periods has been higher or lower than the fee rate reflected in this report. Clients may have a higher or lower rate depending on their portfolio. Westmount’s fees are described in Part 2A of our Form ADV, which is available upon request.
The market indices shown are provided to assist clients in evaluating Westmount’s performance relative to the markets in which we invest. You cannot invest directly in an index. Westmount’s portfolios are not intended to perfectly mirror the relevant indices, may have more or less volatility than the indices, and may invest in markets and strategies not represented by any of the indices shown. The indices are unmanaged and do not carry fees or expenses.
If you have any comments or questions about this article, please contact us at info@westmount.com.