Reconsidering the traditional 60/40 portfolio Diversify this "all weather" asset mix with these strategies. Update by Terrence Demorest, Chief Investment Officer - Public Markets and ESG
Update by Terrence Demorest, Chief Investment Officer - Public Markets and ESG
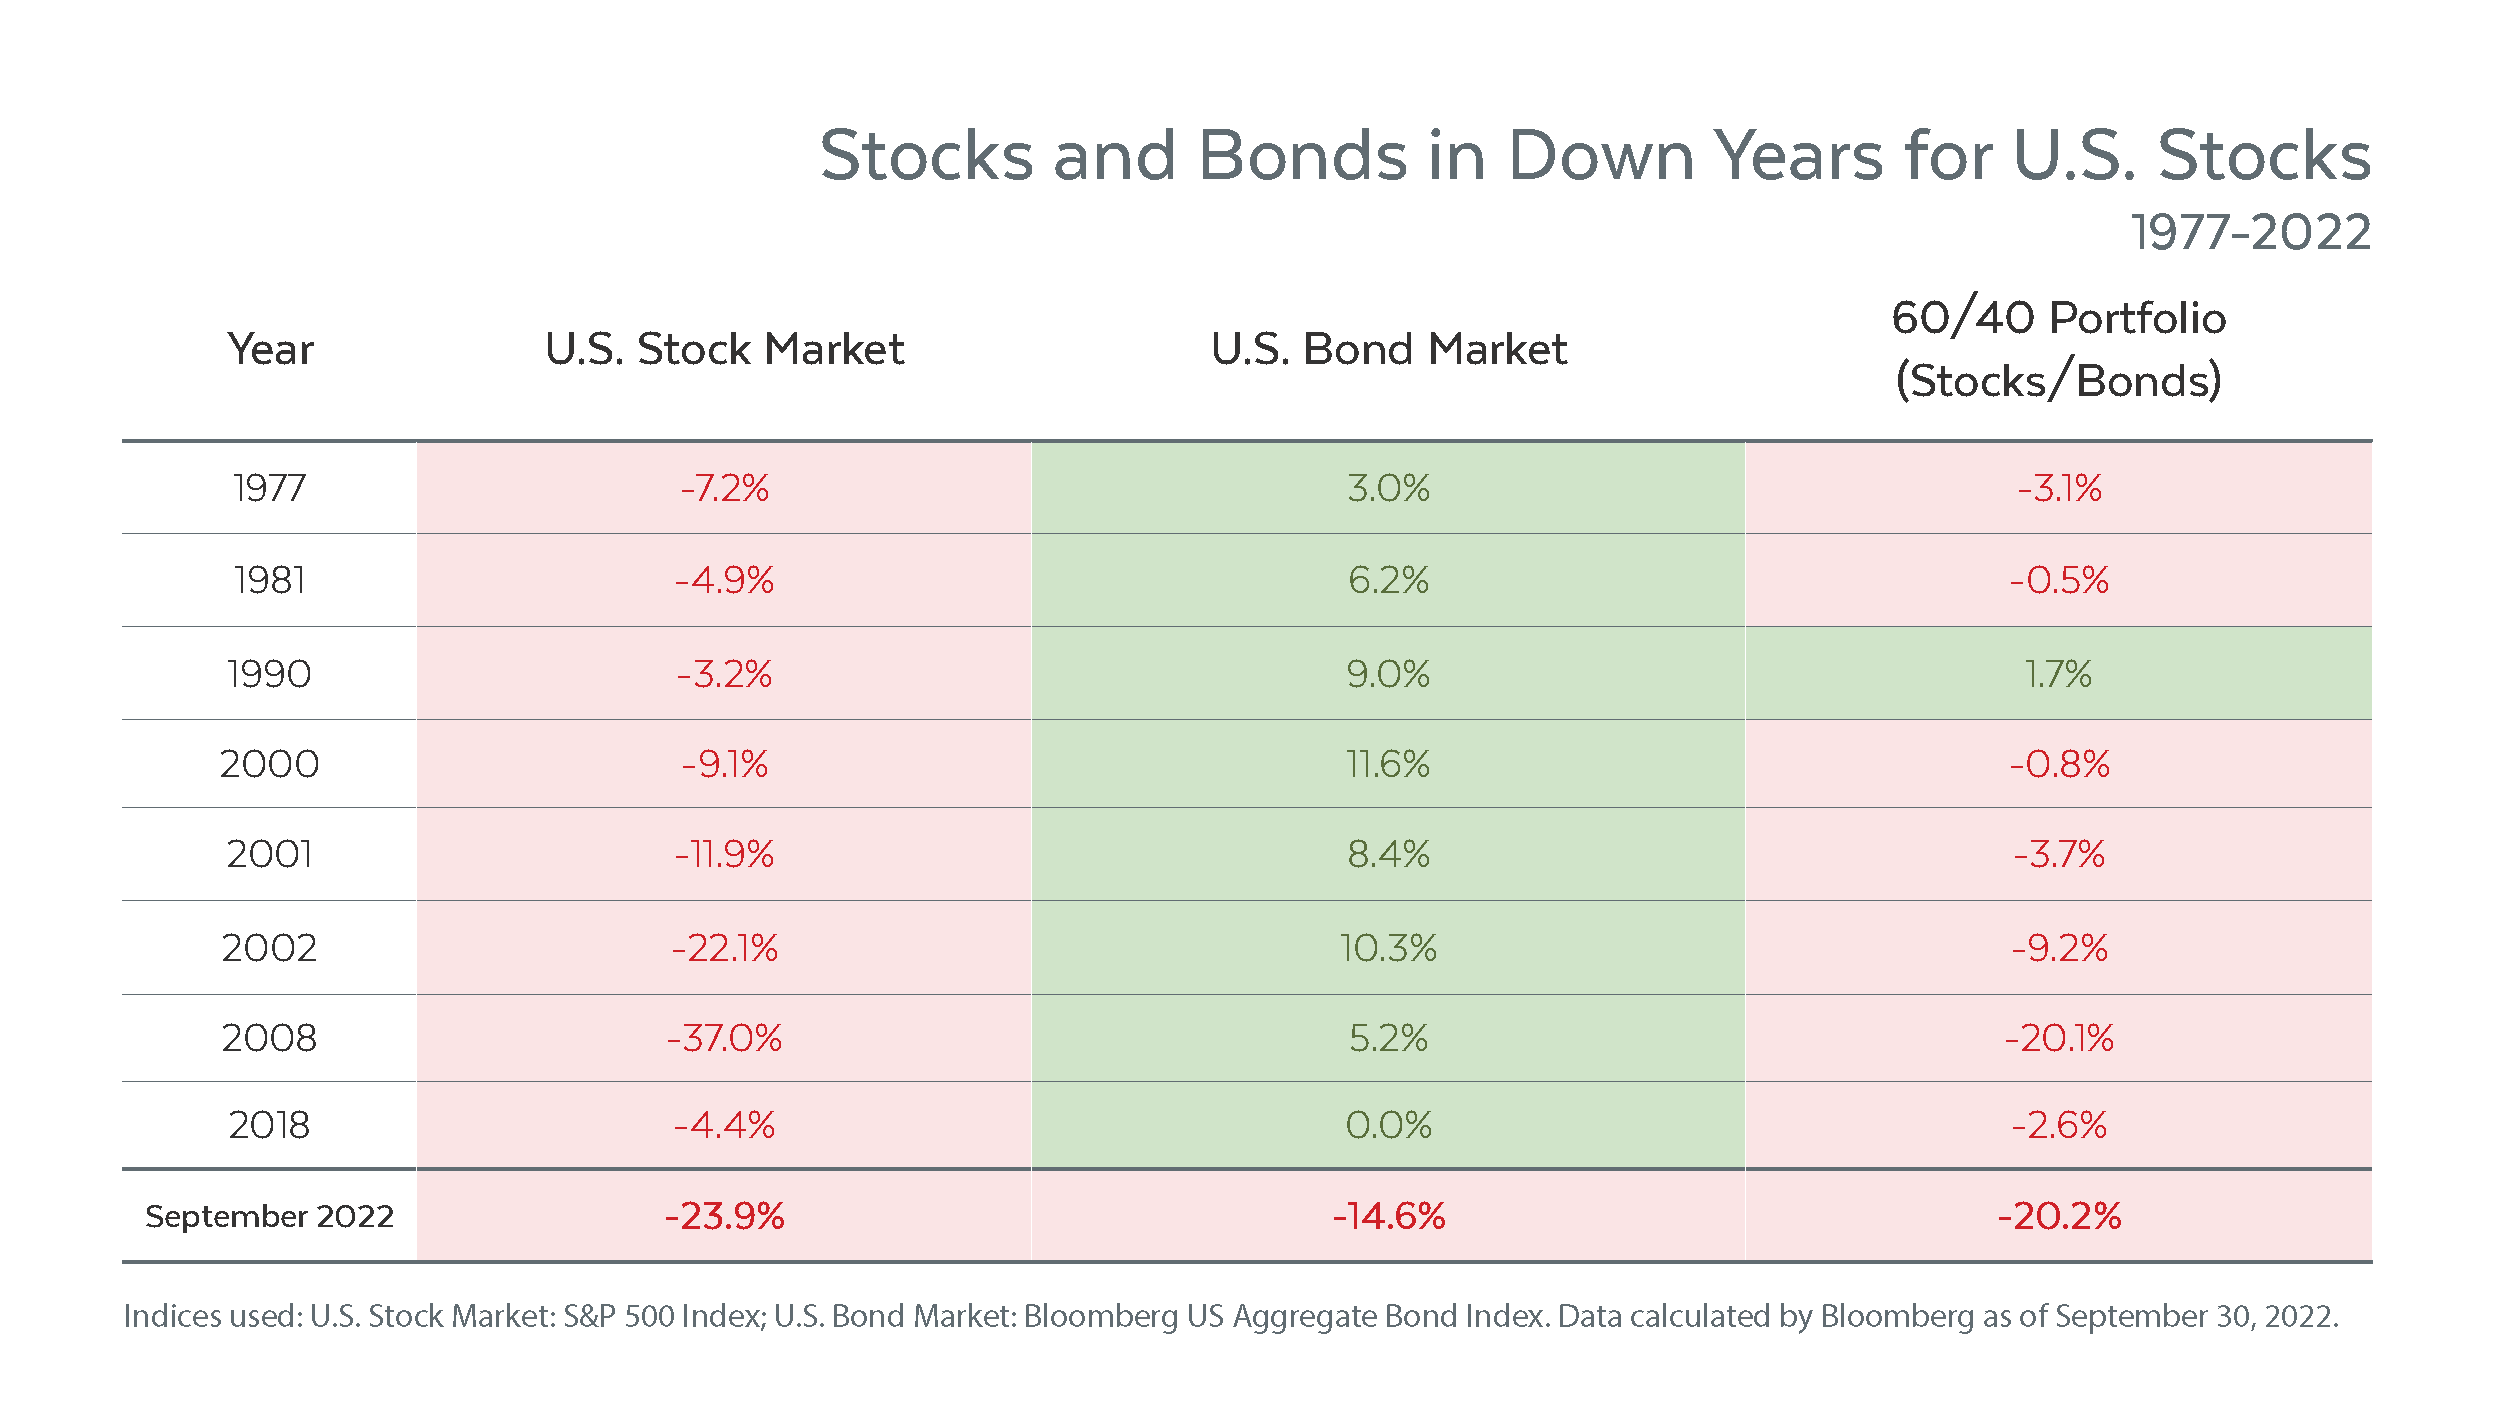
You may be familiar with the concept of a “60/40 portfolio,” a moderate asset mix that is tilted toward long-term growth with a 60% stock allocation, but which also holds a meaningful 40% allocation to a more conservative asset class—bonds—to balance, at least in part, the inherent volatility of stocks. Both in theory and practice, the allocation to bonds in this “all weather” portfolio has helped investors cushion much of the downside in rough years for the stock market. But not this year.
In the chart below you can see that in nearly every year in which stocks have declined sharply, bonds have had positive returns, providing investors with some relief from the plunge in the stock market. In 2022, though, bonds have provided inadequate relief, as bonds are experiencing their worst year ever. As a result, in the first three quarters of 2022 the 60/40 portfolio is having its worst overall return in over 80 years and is on track to deliver its second worst performance in history (after 1931).
Fortunately, the traditional 60/40 portfolio can be modified in order to experience much of the relief that it has provided in the past. For one, in the unique low-yielding bond environment we have been living with for years, there have been ways to seek better returns from niche bond market segments while also reducing their downside exposure from rising interest rates. This is precisely what has been behind our bond strategy in recent years, as we’ve found ways to improve the bond allocation’s return while protecting it materially from price declines when rates have risen. As of Sept. 30, our bond portfolios have outperformed the bond market by approximately 9.5%.
Another way to enhance the 60/40 portfolio is by taking this simple mix a big step further, adding a third asset class (broadly categorized as “alternative assets”) to reap more fully the benefits of diversification. By incorporating other attractive asset classes that do not necessarily move in lockstep with stocks or bonds, investors can increase the chances of having better returns when stocks (and this year, also bonds) take their lumps.
For Westmount clients, this has occurred in a very meaningful way this year, with our alternative asset investments in private credit. These high income-producing loans have provided consistent returns to counterbalance the volatile markets. This year (through Sept. 30), our core alternatives have produced positive returns when the traditional asset classes are bleeding red.
To be sure, the plunge in the stock and bond markets have negatively impacted all investors, including Westmount clients. However, by tactically repositioning our bond allocation, and by complementing bonds and stocks with the addition of private credit, their moderately balanced portfolios have performed much more favorably than a 60/40 portfolio so far in 2022.
Recent posts
Diversified portfolios surge in Q2, led by a powerful stock market rally
A Quarter Notes market update
Disclosures
This report was prepared by Westmount Partners, LLC (“Westmount”). Westmount is registered as an investment advisor with the U.S. Securities and Exchange Commission. The information contained in this report was prepared using sources that Westmount believes are reliable, but Westmount does not guarantee its accuracy. The information reflects subjective judgments, assumptions and Westmount’s opinion on the date made and may change without notice. Westmount undertakes no obligation to update this information. It is for information purposes only and should not be used or construed as investment, legal or tax advice, nor as an offer to sell or a solicitation of an offer to buy any security. No part of this report may be copied in any form, by any means, or redistributed, published, circulated or commercially exploited in any manner without Westmount’s prior written consent.
The performance figures for the representative Westmount Moderate Balanced portfolio are derived from the composite performance of the alternatives and bond portions of all fully-invested client accounts. Client allocations are customized and may have different asset mixes and performance. The actual performance and allocation of individual client accounts will vary. Performance figures include the reinvestment of dividends and are net of all investment costs except Westmount’s advisory fee, which is 1% annually or less, generally depending on a client’s portfolio size. Westmount’s fees are described in Part 2 of our Form ADV, which is available upon request.
Stock and bond market performance data from Bloomberg as of Sept. 30, 2022. Past performance is no guarantee of future results, and investing in stocks, alternatives, and bonds carries the possibility of loss of principal. Securities transactions carry risk and are not suitable for all investors. Before making an investment decision, you should consider whether this information is appropriate in your circumstances.
The various market indices and representative portfolios on the chart are provided to assist clients in evaluating Westmount’s performance relative to the markets in which we invest. Westmount’s portfolios are not intended to perfectly mirror the relevant indices, may have more or less volatility than the indices, and may invest in markets and strategies not represented by any of the indices shown. The indices are unmanaged and do not carry fees or expenses.
If you have any comments or questions about this article, please contact us at info@westmount.com.