Navigating the markets following the COVID meltdown Market Review From the Westmount Investment Team
Market Review From the Westmount Investment Team
11 January 2024
While the COVID virus has not faded from the scene, the enormous economic and market dislocations attributable to the pandemic have largely worked themselves through the economy. It’s been a rocky road to get to this point (a roller coaster ride might seem more analogous), and it’s worth taking a look back at the journey over the past three years.
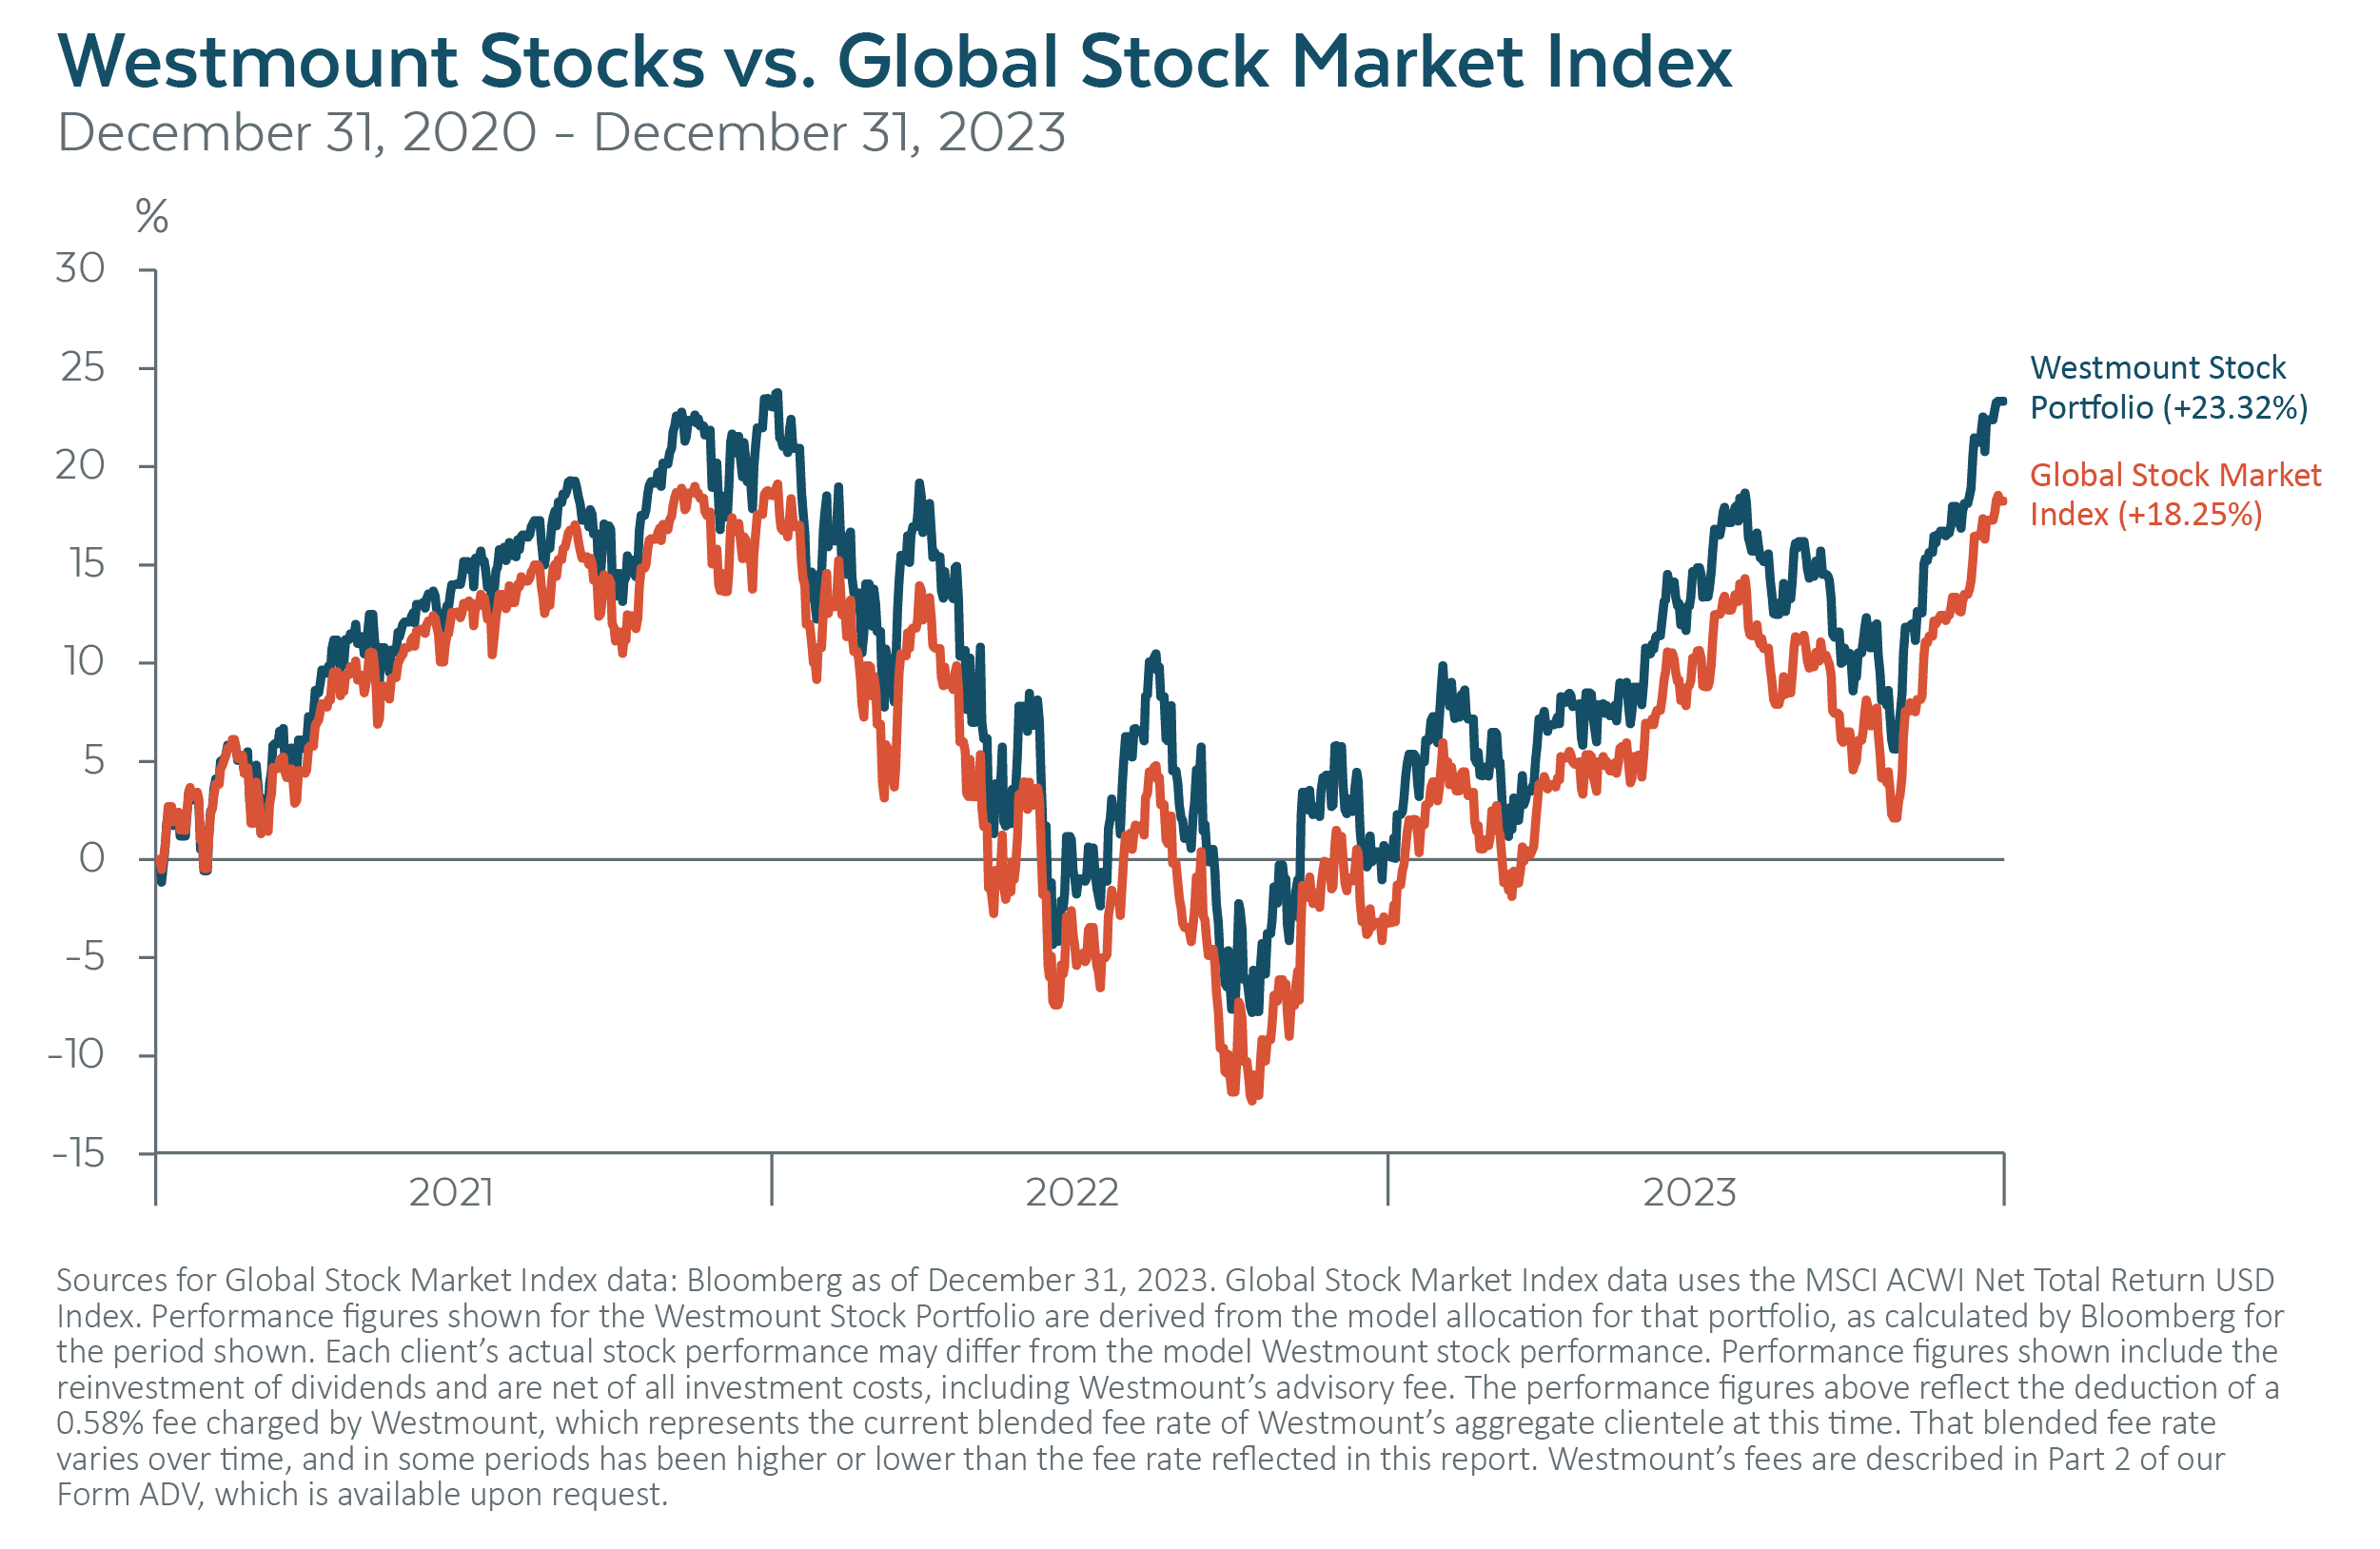
Stocks. Coming out of the massive pandemic selloff in 2020, we positioned the stock portion of our clients’ portfolios to capture the market’s return (up and down) in the most diversified, low-cost, and tax-efficient manner. While still providing exposure to U.S. and foreign companies and businesses large and small, we overweighted the portfolios to large U.S. corporations (using the S&P 500 Index for this exposure), believing that these companies were in the best relative position to weather the storm and recovery.
As the chart below reveals, this strategy has enabled our clients to track the markets closely, through thick (2021 and 2023) and thin (2022). The overweight to large U.S. companies has enabled the stock portfolios to outperform the market index, which has modestly different weightings. This result has been achieved with extremely low cost (the average annual expense ratio of the core equity portfolio is 0.05%), and it’s also been hugely tax-efficient along the way.
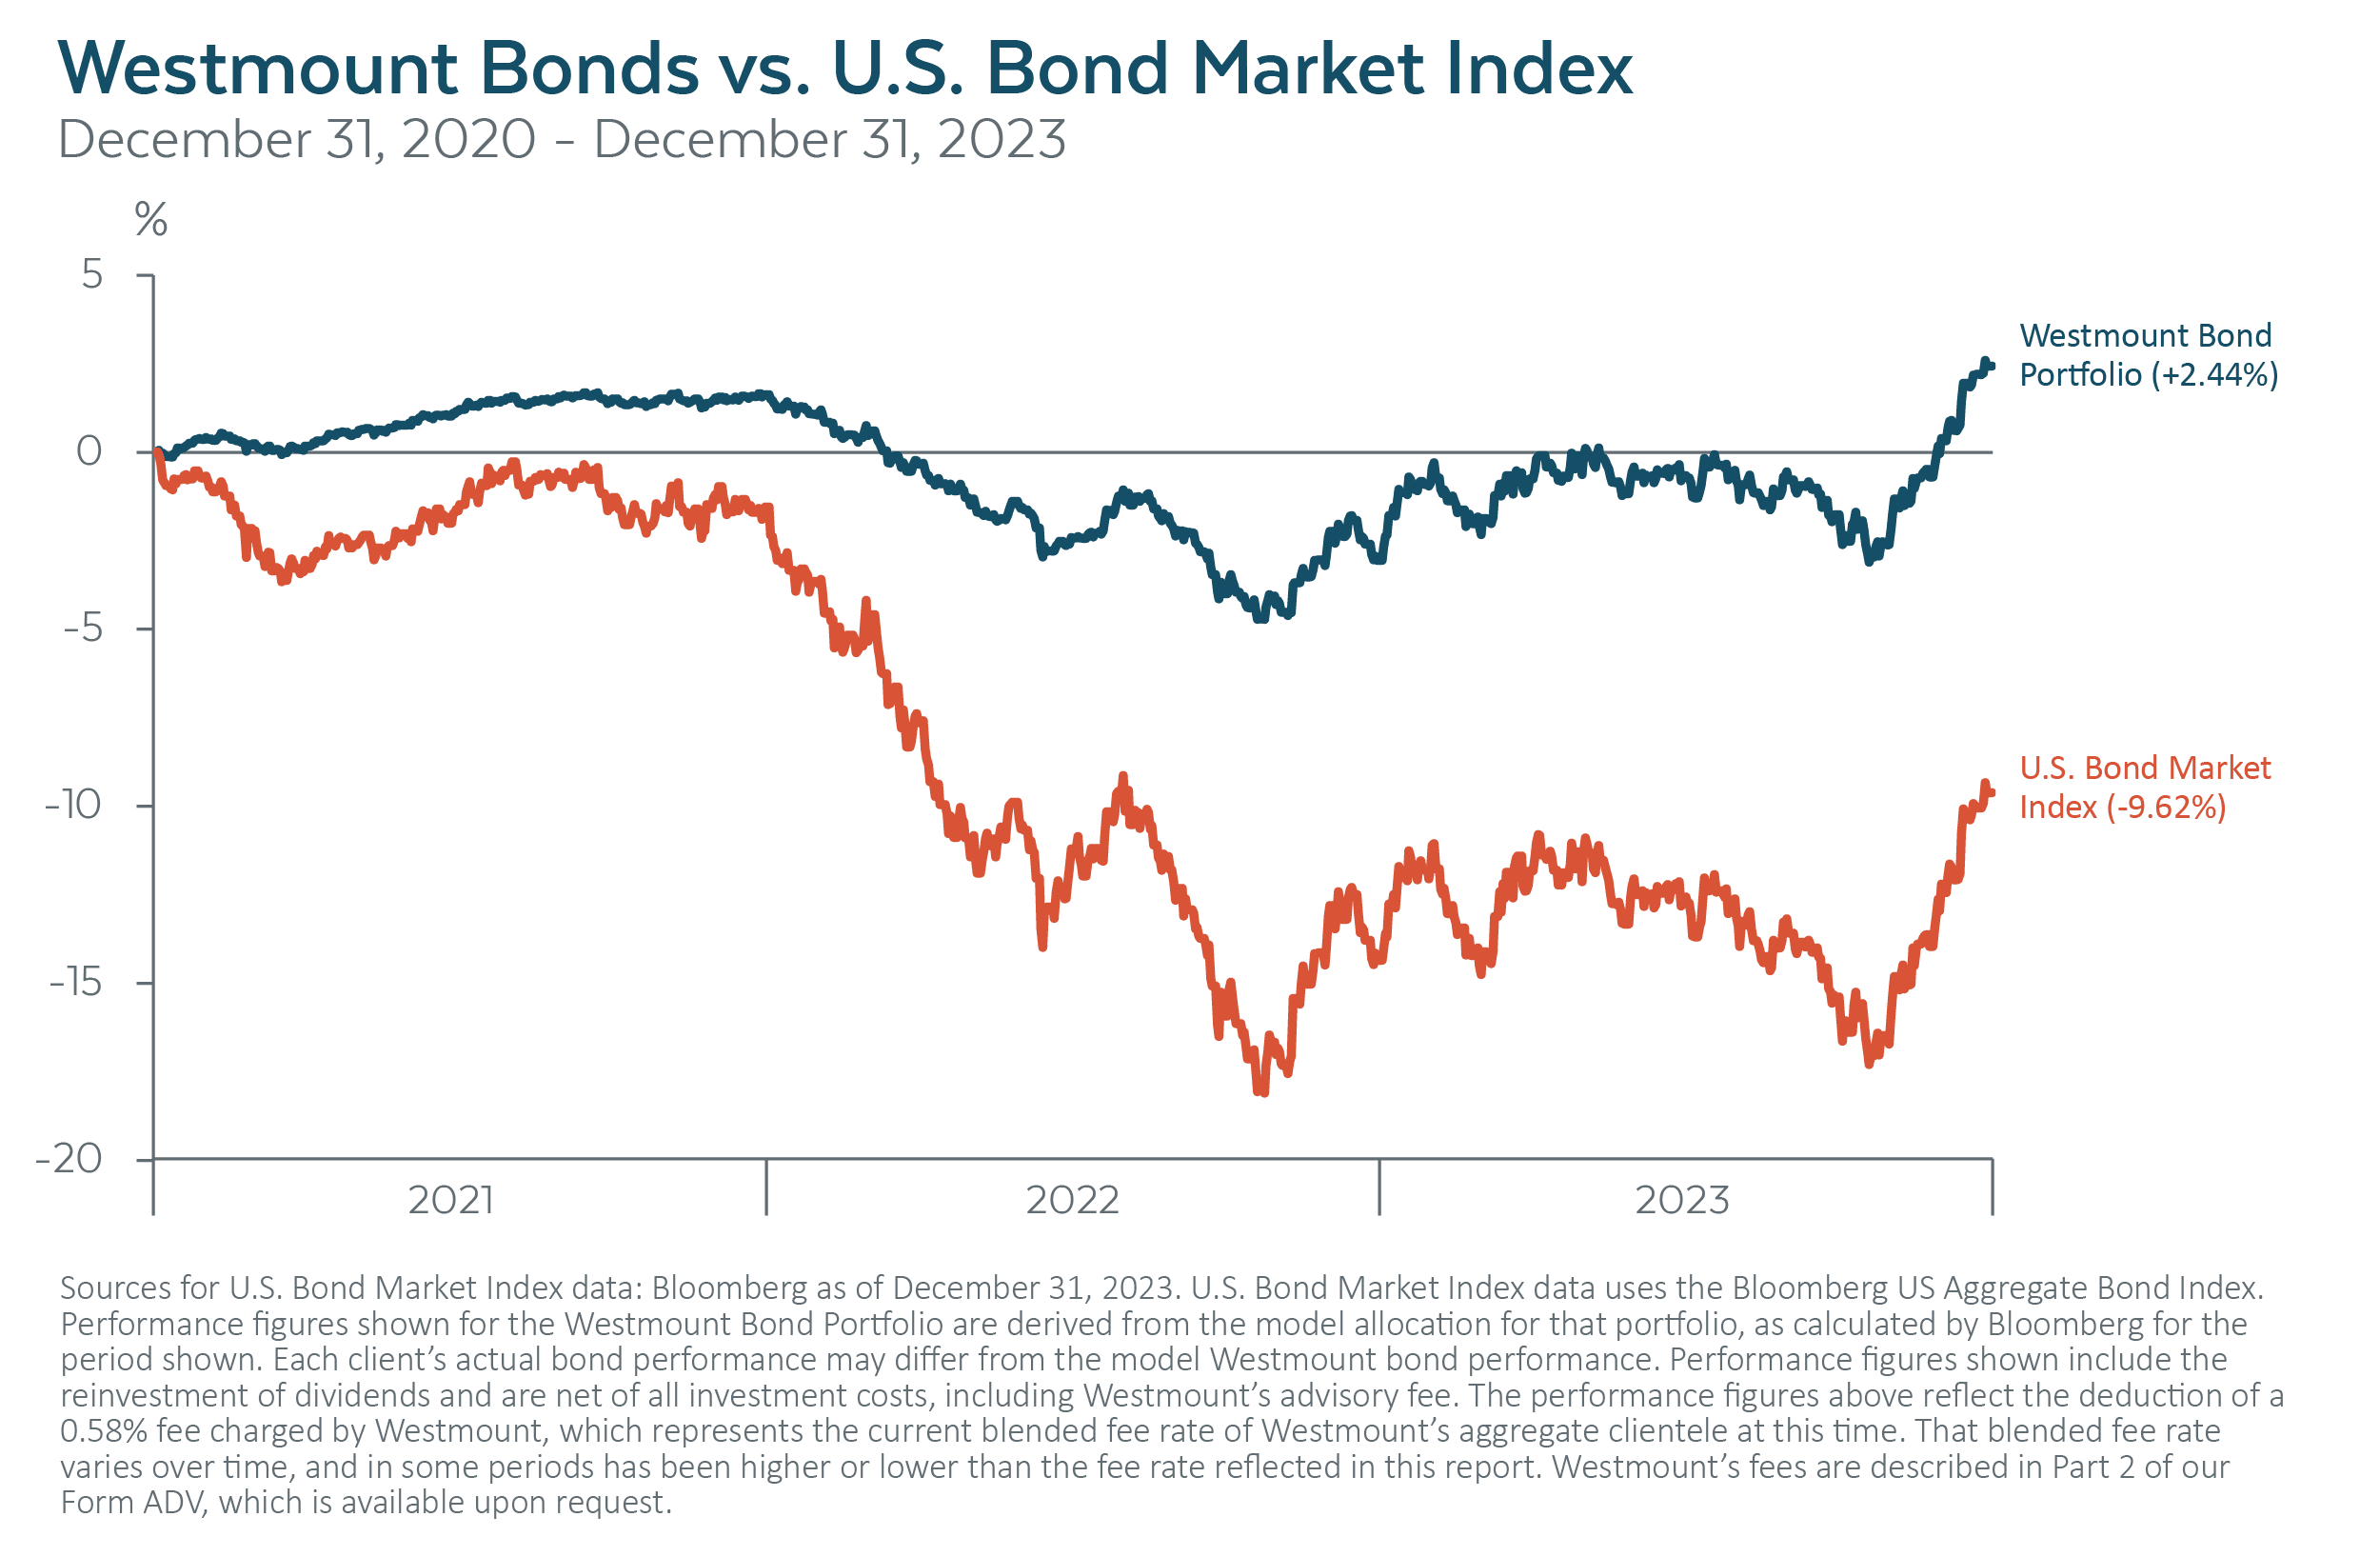
Bonds. In contrast to our stock strategy, we did not want our bonds to mirror the bond market coming out of the COVID meltdown. Yields were simply too meager, and we fully expected the Fed to raise interest rates aggressively to crush high inflation stemming largely from supply chain problems and the government’s massive infusion of liquidity into the economy to navigate the crisis. Rising rates generally cause bond prices to fall, so we lowered the maturity profile of the underlying bond portfolio and assumed somewhat greater credit risk in order to significantly reduce the ill effects (on bonds) of the Fed’s hike in interest rates. This approach has also resulted in significant outperformance relative to the bond market, particularly in 2022 when rates shot up the most.
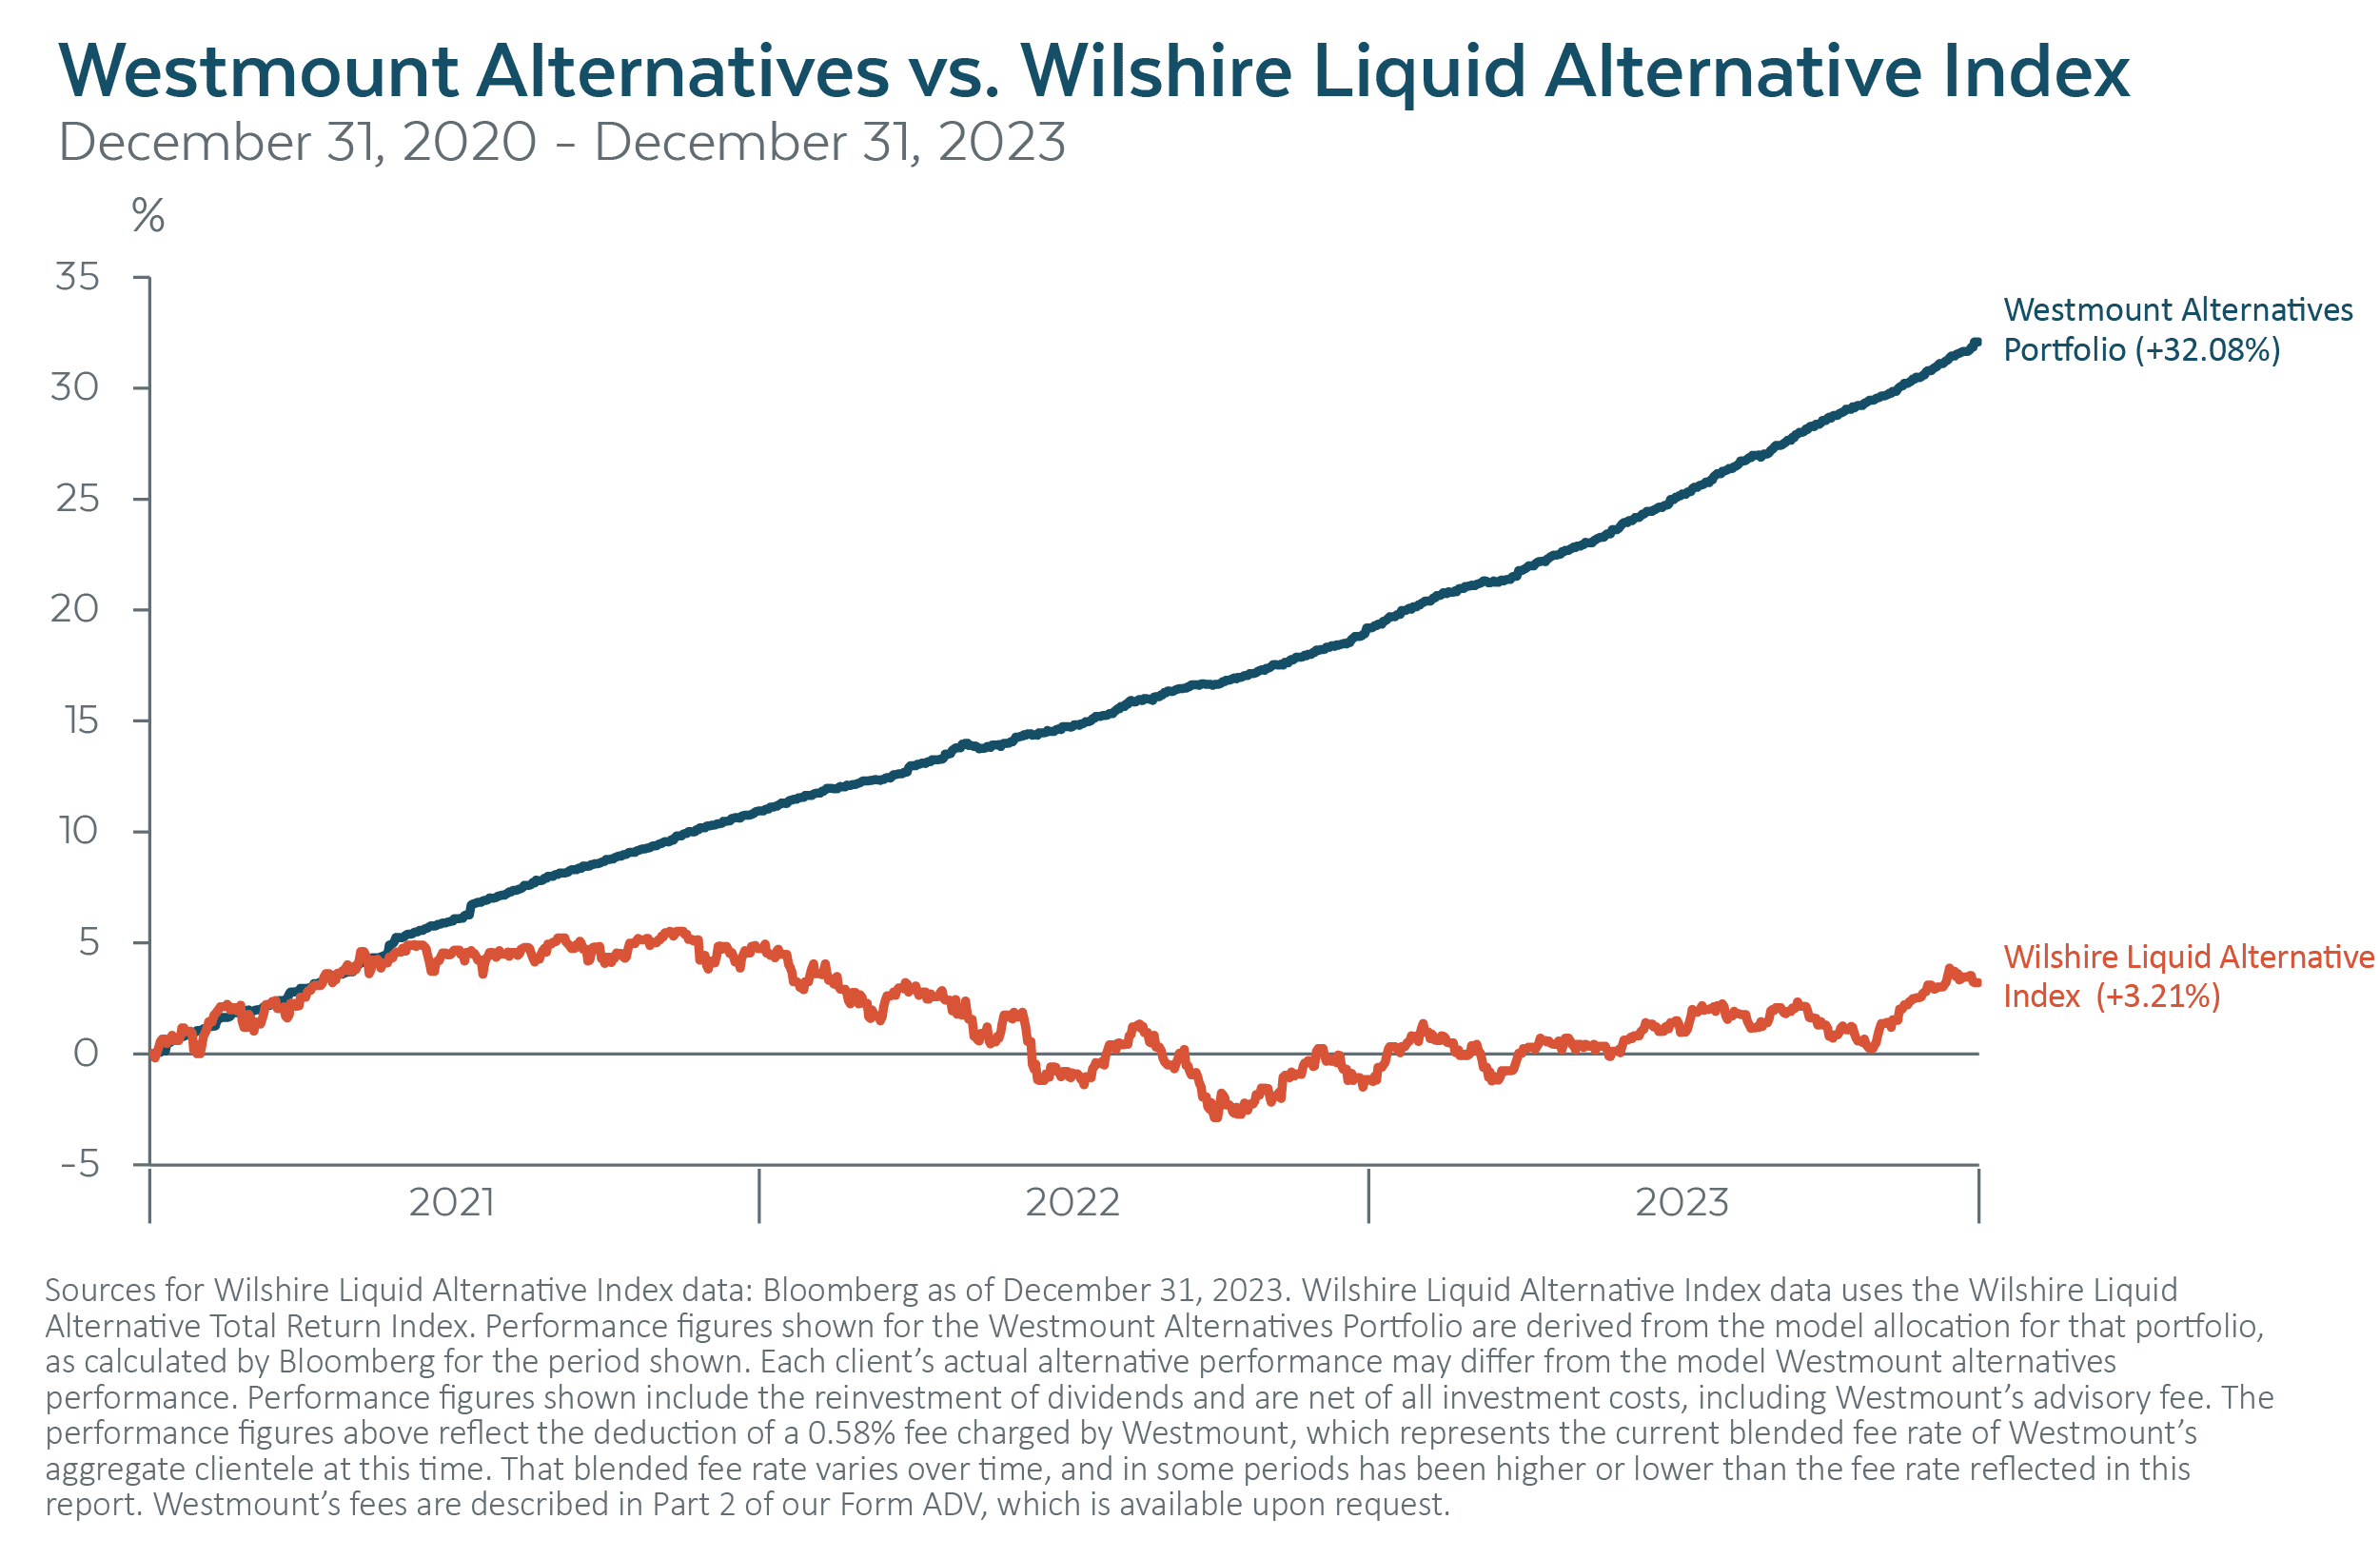
Alternative assets. Finally, with alternative assets, we have always sought to identify the most promising asset classes and strategies that, ideally, do not typically move in lockstep with the stock or bond markets. In 2020 we found that in private credit (private lending to businesses and on real estate). Between 2021 and 2023, private credit has been the mainstay of our alternative exposures.
This has also proven to be rewarding, both in the returns these holdings have delivered, and also in the degree to which they have proven to be uncorrelated to the stock and bond markets. This was clearly seen in their strong positive performance in 2022, while the stock and bond markets plunged.
Recent posts
Disclosures
This report was prepared by Westmount Partners, LLC (“Westmount”). Westmount is registered as an investment advisor with the U.S. Securities and Exchange Commission. The information contained in this report was prepared using sources that Westmount believes are reliable, but Westmount does not guarantee its accuracy. The information reflects subjective judgments, assumptions and Westmount’s opinion on the date made and may change without notice. Westmount undertakes no obligation to update this information. It is for information purposes only and should not be used or construed as investment, legal or tax advice, nor as an offer to sell or a solicitation of an offer to buy any security. No part of this report may be copied in any form, by any means, or redistributed, published, circulated or commercially exploited in any manner without Westmount’s prior written consent.
Performance figures shown include the reinvestment of dividends and are net of all investment costs, including Westmount’s advisory fee. The performance figures above reflect the deduction of a 0.58% fee charged by Westmount, which represents the current average blended fee rate of Westmount’s aggregate clientele at this time. That blended fee rate varies over time, and in some periods has been higher or lower than the fee rate reflected in this report. Clients may have a higher or lower rate depending on their portfolio. Westmount’s fees are described in Part 2 of our Form ADV, which is available upon request.
The market indices shown are provided to assist clients in evaluating Westmount’s performance relative to the markets in which we invest. You cannot invest directly in an index. Westmount’s portfolios are not intended to perfectly mirror the relevant indices, may have more or less volatility than the indices, and may invest in markets and strategies not represented by any of the indices shown. The indices are unmanaged and do not carry fees or expenses.
If you have any comments or questions about this article, please contact us at info@westmount.com.