Navigating private market performance Key metrics every investor should know Analysis by Sam Pecka, Senior Research Analyst
Analysis by Sam Pecka, Senior Research Analyst
Investors are allocating to private markets like never before. Since 2018, assets under management for private markets have grown by roughly 20 percent, comprising roughly $13.1 trillion as of June 2023.1
While the chief appeal of private investments lies in how they behave, especially relative to traditional assets like publicly traded stocks and bonds, investors must also understand that there are important differences in how these investments are measured.
With traditional investments, portfolio managers rely on widely accepted benchmarks like the S&P 500 and Dow Jones Industrial Average to gauge the relative performance of a given individual stock or fund. Fluctuations may occur throughout the trading day, but at any point in time the underlying stock or fund price is readily available for all to see—no further contextualization is required. Consequently, calculating an individual stock or mutual fund’s return on investment (ROI) becomes a simple arithmetical exercise.
In the private markets, investments are structured and managed differently. Portfolio managers must account for additional factors like irregular cash flows, longer holding periods, and reinvestment windows, making it substantially harder to establish reliable, industry-wide benchmarks to compare performance numbers. For that reason, portfolio managers must rely on alternative metrics that can provide a more comprehensive and accurate picture of how a given private fund is performing and how it’s being managed over time.
Two key metrics—Internal Rate of Return (IRR) and annualized return—are among those preferred by investment professionals when evaluating private investment performance.
Understanding the Essentials
The annualized return metric measures the simple compounded return per year over an investment’s life. It converts an investment’s total return into an average annual percentage, making it easier to compare with other investments that have different time horizons. Importantly, the calculation assumes a steady annual growth rate.
Since return streams in such investments are rarely constant, the annualized return helps investors assess performance over time rather than focusing on a single period. For instance, an evergreen fund might return 8% in year 1 and 10% in year 2, resulting in an annualized return of 9% over those two years or a total cumulative return of 18.8%. The annualized figure, when understood, allows for more effective comparison with other investments.
Calculating returns on an annualized basis instead of just looking at total return can help investors better assess the investment’s performance relative to a typical yearly return metric—despite periodic fluctuations. That said, it is important to note that while annualized return can provide a practical performance vector, it may oversimplify the return profile of an investment with more complex cash flow timing and sizing.
Another metric, the Internal Rate of Return (IRR), provides a more accurate measure for scenarios with multiple cash flows occurring at varying times and amounts. Calculating IRR requires more precise data, including the date and amount of each cash flow going into or resulting from an investment. This makes this metric more appropriate for evaluating longer-term drawdown funds, which have more complexity around when capital is called and returned.
The IRR metric is useful because it accounts for the time value of money, showing how much an investment will return annually by accounting for the timing and amount of cash flows (as opposed to annualized return, which assumes a steady growth rate and consistent cash flows).
Given that cash flows in more traditional private investments tend to occur at irregular intervals, IRR helps investors better understand an investment’s true return by factoring in when those cash flows occur. However, there are some limitations. Notably, the IRR metric doesn’t account for how much risk was taken, nor does it reflect an investment’s total return. It’s also important to note that IRR only considers invested dollars; uncalled commitments are excluded from the calculation.
Comparing investments across different metrics
Since the IRR metric fluctuates based on the timing of cash flows, it can offer greater detail when cross-comparing other investment outcomes in an investor’s portfolio. For example, if an investment shows significant returns early on, its IRR may skew higher than its annualized return. But if substantial returns are delayed, the IRR may be lower.
“The main takeaway is that the same total return or multiple can be achieved with an annualized return that looks far different than an Internal Rate of Return because the annualized return conveys a simple compounded return, while the IRR factors the timing of those returns,” explains Dimitri Krikelas, Westmount’s Chief Investment Officer for Private Markets. “If one investment is projected to achieve a 20% IRR while another is targeting an 11% annualized return, the total returns from both options could generate similar multiples. Investors should be mindful of this when making decisions.”
In this case, the “multiple” mentioned above refers to a third metric—the Multiple on Invested Capital (MOIC)—that is useful for conceptualizing total return and understanding how the annualized return and IRR metrics stack up against each other. The MOIC metric focuses solely on an investment’s total return relative to the initial capital, regardless of when those returns were realized.
For example, if an investor committed $1 million to a project that’s now worth $4 million, the MOIC would be 4x. And in some cases, the MOIC is remarkably similar across two investments where one tracks annualized return and another tracks IRR. Therefore, MOIC can be especially useful for understanding the total return on investment irrespective of time since it focuses solely on the total return relative to the initial capital, regardless of when those returns were realized.
“It’s largely an issue of perception, where the MOIC paves the way for a more actionable comparison across investments,” adds Krikelas. “For example, if you asked a client if they’d prefer an 11% annualized return from an evergreen fund or a 20% IRR on a drawdown fund, they’d likely choose the drawdown fund because 20% is a bigger number. So it’s important to make this distinction because the client could be getting a 2.7x multiple in either scenario, where $1 invested would ultimately yield $2.7 across both investments.”
2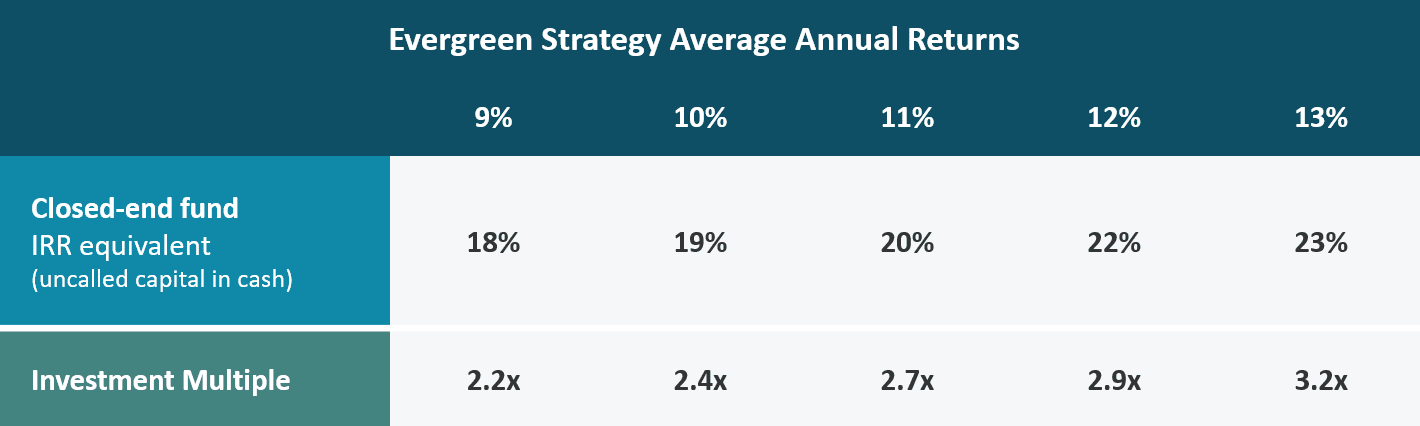
Practical Application
At Westmount, the metrics we use depend on the specific type of investment. For example, we traditionally use IRR to measure the performance of drawdown funds, vehicles that tend to call capital over a two- to five-year period and return capital within a seven- to 10-year window. Since the lifespan of drawdown funds can exceed 10 years, the timing of cash flows is vitally important to understanding performance.
Contrarily, evergreen funds have no fixed end date, allowing investors to make long-term investments in private companies. And because all of the invested capital is immediately invested, the annualized return is a more appropriate and widely used metric in this case.
“If you’re a private markets investor, you need to understand the differences. Otherwise, you might be taking on unnecessarily higher risks or illiquidity for the same results,” Krikelas adds. “For this reason, we favor evergreen vehicles because the funds are invested upfront, and investors can begin to enjoy the benefits of compounding from Day 1.”
| Metric | IRR | Annualized Return |
|---|---|---|
| Pros | • Accounts for the timing and size of cash flows. • Provides a single rate representing overall performance. • Allows for comparison between various investment projects with different cash flow patterns and maturities. |
• Allows for straightforward comparisons over different time periods. • Easy to understand and communicate to investors. • Useful for assessing an investment’s long-term performance. |
| Cons | • Can be misleading for investments with unusual cash flow patterns. • The timing of cash flows can affect the outcome. • Calculations may require iterative methods or specialized software. |
• Does not account for the timing or size of cash flows. • May not accurately reflect short-term performance fluctuations. |
Taking the Next Step
Private market assets typically carry high investment minimums and require investors to have the right relationships, sourcing channels, and due diligence capabilities. To learn more about how we access this space for our clients, call us at 310-556-2502 or visit westmount.com/alternatives.
Recent posts
Qualified small business stock
Discover a powerful yet overlooked tax provision for business owners navigating a sale
Sources
1McKinsey Global Private Markets Review 2024
2Source: Partners Group, as of September 30, 2020. All returns shown are net of fees and expenses. Closed-end fund capital calls and distributions based on real historical cash flow patterns from Cambridge Associates and adjusted based on Partners Group’s forward-looking expected returns framework.
Disclosures
This article was prepared by Westmount Partners, LLC (“Westmount”). Westmount is registered as an investment advisor with the U.S. Securities and Exchange Commission. The material is based in part on information supplied by Westmount and in part upon information obtained from sources it deems to be reliable; however, neither Westmount nor its affiliates shall be deemed to have made any express or implied representations or warranties regarding this material whatsoever, including, without limitation, its accuracy or completeness. Westmount undertakes no obligation to update the contents of this article. It is for information purposes only and should not be used or construed as investment, legal or tax advice, nor as an offer to sell or a solicitation of an offer to buy any security. No part of this article may be copied in any form, by any means, or redistributed, published, circulated, or commercially exploited in any manner without Westmount’s prior written consent.
This information is not intended to be legal, tax, business, or financial advice. Please consult with your applicable professional for such advice. If you have any comments or questions about this report, please contact us at info@westmount.com.