Measuring ESG impact Are your investments creating true societal benefits? Make sure. Market Review by Terrence Demorest, Chief Investment Officer – Public Markets and ESG
Market Review by Terrence Demorest, Chief Investment Officer – Public Markets and ESG
Demand for ESG products is at an all-time high. A report from Broadridge Financial Solutions predicts that ESG assets will exceed $30 trillion by 2030.1 At Westmount, ESG assets under management have grown by 146% since 2020.
One reason ESG is so appealing, fund managers say, is that it allows investors to balance traditional investment objectives with more altruistic ends. But how is that impact being measured? And to what extent are ESG investments responsible for driving those results?
Adding another layer of complexity to the mix is the prevalence of “greenwashing” by some unscrupulous firms and the companies that comprise their funds. Companies are said to be engaged in greenwashing when they overamplify their sustainability efforts and mislead clients into thinking their investments are more environmentally friendly and socially impactful than they really are.
It’s easy to quantify an investment’s returns over time, but gauging actual societal impact can be more difficult. This is an important, albeit relatively new area within the ESG space. Beyond performance, investors—including our clients—want to know that their investments are making a difference.
The good news is that increased regulation, a renewed focus on accountability and reporting, and improved technology are making it harder for companies to hide behind ambiguous reporting standards or marketing gimmicks. Earlier this year, the SEC announced plans to ramp up guidance on corporate disclosures to “promote consistent, comparable, and reliable information for investors.”2 And the European Commission recently finalized its Sustainable Finance Taxonomy, which will guide which corporate activities can be labeled as “environmentally sustainable.”3
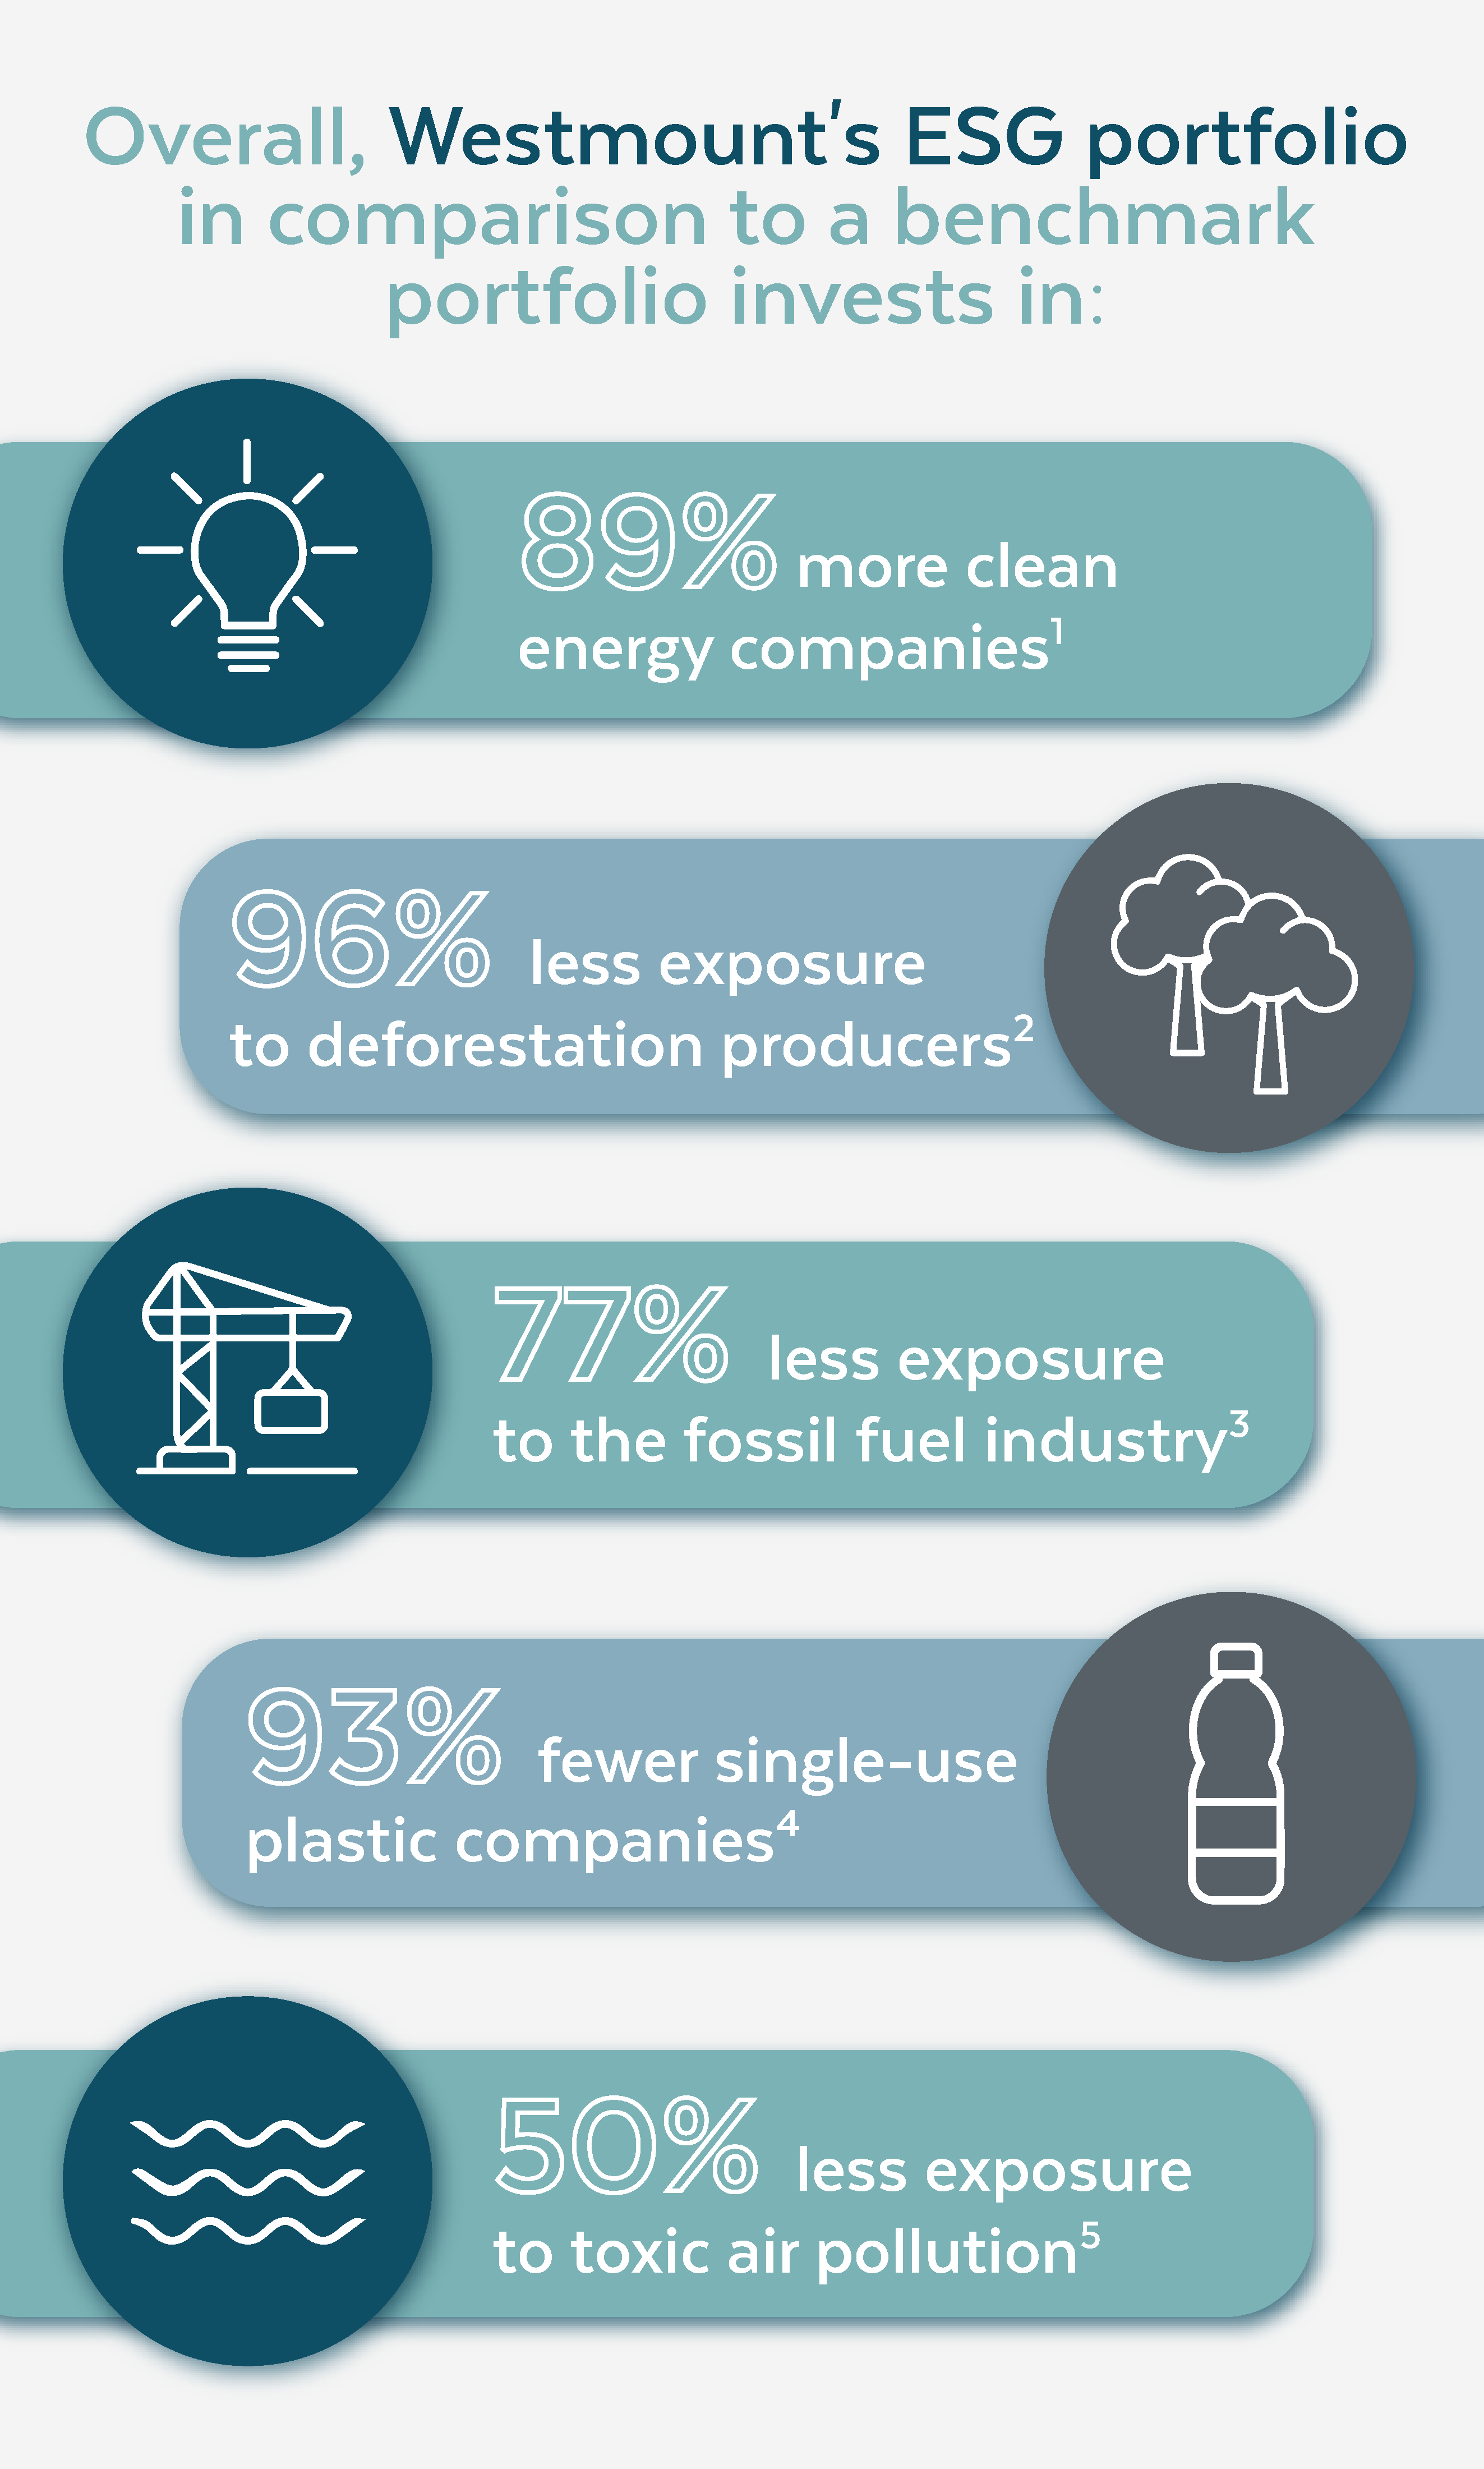
Westmount’s Investment Team, too, has taken steps to provide better insights for its sustainability-minded clients. Earlier this year, Westmount incorporated a new reporting tool called YourStake into its ESG platform. Founded in 2018, YourStake compiles data from annual company reports, academic literature, and over 100 approved sources into a single report to help investors better understand the ESG impact of their investments.
For example, the YourStake analysis compared the companies held in Westmount’s ESG portfolio (through their respective funds) against benchmark data from the total world equity market and found that companies in Westmount’s portfolio resulted in 1,513 more clean energy-powered homes compared to benchmark data.4
YourStake also provides in-depth reporting about shareholder engagement activities—instances where Westmount’s fund managers used their influence as shareholders in a given company to influence a change in certain behaviors or policies that align more closely with ESG values. Through this lens, the YourStake analysis identified approximately 300 examples of companies making a tangible commitment to change as a result of a shareholder engagement campaign.
We’re excited to utilize YourStake’s expertise in social impact data and analytics to further deepen our understanding of the funds we invest in. In doing so, we hope to convey to our clients that their investments are in fact driving positive change.
Learn more
To learn more about Westmount’s ESG portfolio or YourStake, contact your advisor, email info@westmount.com, or call our main office at 310-556-2502.
Recent posts
Diversified portfolios surge in Q2, led by a powerful stock market rally
A Quarter Notes market update
Sources
1 Broadridge | ESG and Sustainable Investment Outlook
2 Securities and Exchange Commission | Press Release (May 25, 2022)
3 U.N. Principles for Responsible Investment | EU Taxonomy
4 Compared to the total U.S. stock market, based on the amount of equivalent clean energy (mwh) produced by a company based on revenue supporting a clean energy economy
Disclosures
This report was prepared by Westmount Partners, LLC (“Westmount”). Westmount is registered as an investment advisor with the U.S. Securities and Exchange Commission. The information contained in this report was prepared using sources that Westmount believes are reliable, but Westmount does not guarantee its accuracy. The information reflects subjective judgments, assumptions and Westmount’s opinion on the date made and may change without notice. Westmount undertakes no obligation to update this information. It is for information purposes only and should not be used or construed as investment, legal or tax advice, nor as an offer to sell or a solicitation of an offer to buy any security. No part of this report may be copied in any form, by any means, or redistributed, published, circulated or commercially exploited in any manner without Westmount’s prior written consent. If you have any comments or questions about this report, please contact us at info@westmount.com.
Infographic Disclosures
1Companies with the highest clean economy revenues, and pure-play clean energy companies
2Agriculture commodity producers and traders linked to deforestation
3Companies operating in the fossil fuel industry and utilities powered by fossil fuels
4Companies that produce plastic
5Harm done by toxic air pollution released in the U.S. by the company, using EPA data